Flowcharts are a great way to formalize the methodology for a new project. My team at work uses them as a tool in our brainstorming sessions and—once the ideation event wraps up—the flowchart becomes the project methodology (at least until someone changes it). My project methodology flowcharts are high-level and pretty straightforward—typically they contain just process, decision, and terminator objects—though they can be composed of many tens of these objects.
I work primarily in my Linux desktop environment, and most of my office colleagues use Windows. However, we're increasing our use of G Suite in part because it minimizes distractions related to our various desktop environments. Even so, I would prefer to find an open source tool—preferably a standalone app, rather than one that's part of another suite—that offers great support for flowcharts and is available on all the desktops our team uses.
It's been over four years since Máirin Duffy reviewed Linux diagramming tools, so I decided to take a look at what's out there now for open source flowchart makers. I identified the following nine candidates:
| Candidate name | Linux desktop | Available for Windows? | Available for MacOS? |
|---|---|---|---|
| Dia | GNOME | Yes | Yes |
| LibreOffice Draw | GNOME | Yes | Yes |
| Inkscape | GNOME | Yes | Yes |
| Calligra Flow | KDE | Preliminary | Preliminary |
| Diagramo | Browser | Browser | Browser |
| Pencil | ? | Yes | Yes |
| Graphviz | CLI | Yes | Yes |
| Umbrello | KDE | Yes | Yes |
| Draw.io | Browser | Browser | Browser |
I'll share a bit of information about each below.
Dia
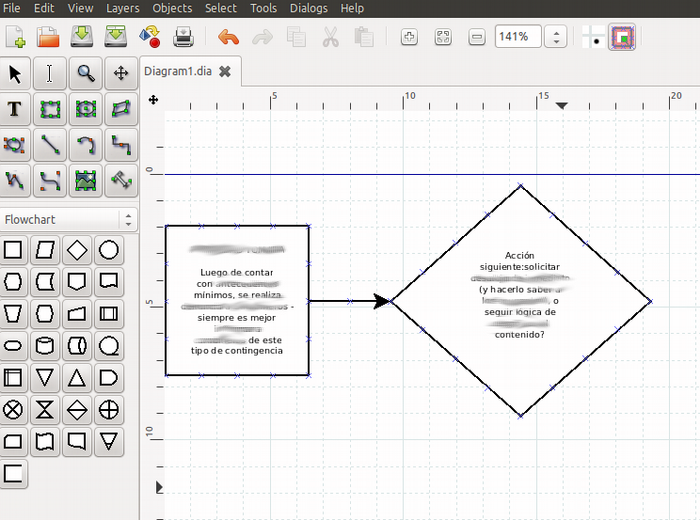
I reviewed Dia 0.97.3 from the Ubuntu 18.04 repository; you can download it here.
Dia is a standalone drawing tool. It offers some additional components, such as dia-rib-network for network diagrams and dia2cod for converting UML to code.
The installation process dragged in a few other packages, including: dia-common, dia-shapes, gsfonts-x11, libpython-stdlib, python, python-cairo, and python-gobject2.
Dia's documentation is quite thorough and available in English, German, French, Polish, and Basque. It includes information on related utilities; versions for Linux, Windows, and MacOS; a lot of stuff related to shapes; and much more. The bug tracker on the project's website is disabled, but bug reports are accepted on GNOME Bugzilla.
Dia has complete support for making flowcharts—appropriate symbols, connectors, lots of connection points on objects, annotation for objects, etc. Even so, Dia's user experience (UX) feels unusual. For example, double-clicking on an object brings up properties and metadata, rather than the object's annotation; to edit annotation, you must select the object and click on Tools > Edit Text (or use the F2 key). The default text size, 22.68pt, or about 8mm, seems a bit weird. The text padding default is very large (0.50), and even when it's reduced by a factor of 10 (to 0.05), it still may leave a wide gap around the text (for example in the diamond decision object). You must also select the object before you can right-click on it. Cutting and pasting are somewhat limited—I couldn't copy text from my browser (with the standard Ctrl+C) and paste it into Dia. Dia launches ready to work with a multipage drawing, which is pretty handy if you need to make a 1x2 meter drawing and your printer accommodates only letter-size paper.
In general terms, performance is very snappy. Interaction can seem a bit odd (see above), but it doesn't require huge adjustments to get the hang of it. On the downside, the Help menu did not link properly to documentation, and I couldn't find a spell checker. Finally, from what I can tell, there is no active development on Dia.
LibreOffice Draw
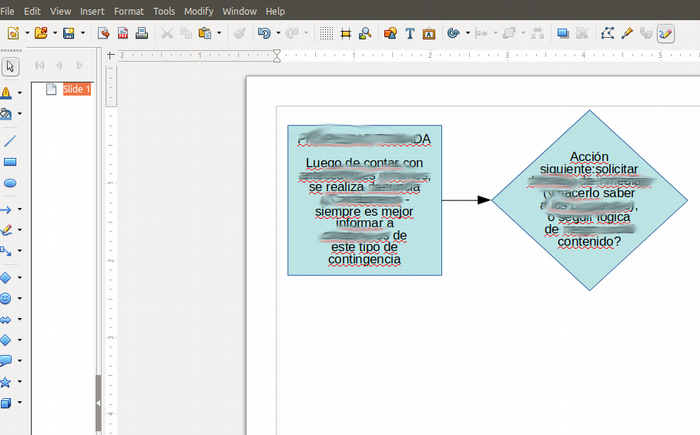
I reviewed LibreOffice Draw version 6.0.4.2, which was installed by default on my Ubuntu 18.04 desktop.
Since LibreOffice Draw is part of the LibreOffice suite, the UX will be familiar to anyone who uses LibreOffice Writer, Calc, or Impress. However, if you are looking for a standalone flowcharting tool and don't already use LibreOffice, this is likely to be a large install.
The application includes an extensive help facility that is accessible from the Help menu, and you can find a great deal of information by searching online.
LibreOffice Draw has a set of predefined flowchart shapes that support annotation as well as connectors. Connection points are limited—all the shapes I use have just four points. Draw's UX will feel familiar to LibreOffice users; for example, double-clicking an object opens the object's annotation. Text wraps automatically when its length exceeds the width of a text box. However, annotation entered in a drawing object does not wrap; you must manually break the lines. Default text size, spacing, etc. are reasonable and easily changed. Draw permits multiple pages (which are called slides), but it doesn't support multipage drawings as easily as Dia does.
In general terms, LibreOffice Draw provides good, basic flowcharting capability with no UX surprises. It performs well, at least on smaller flowcharts, and standard LibreOffice writing tools, such as spell check, are available.
Inkscape
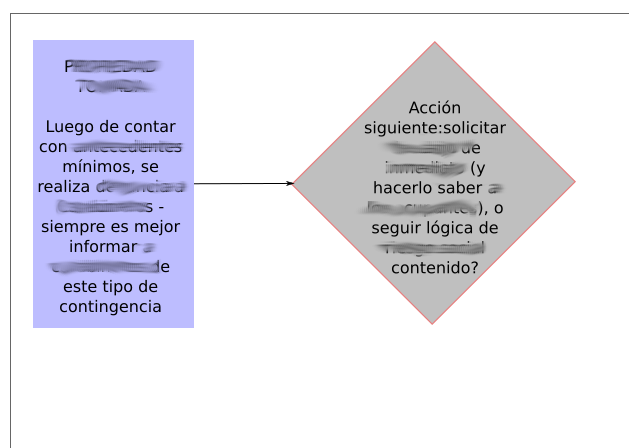
I reviewed Inkscape version 0.92.3 from the Ubuntu 18.04 repositories; you can download it here.
Inkscape is a standalone tool, and it is waaaaaay more than a flowchart drawing utility.
The installation process dragged in several other packages, including: fig2dev, gawk, libgtkspell0, libimage-magick-perl, libimage-magick-q16-perl, libmagick+±6.q16-7, libpotrace0, libsigsegv2, libwmf-bin, python-scour, python3-scour, scour, and transfig.
There is a great deal of Inkscape documentation available, including the Inkscape Manual available from the Help menu. This tutorial made it easier to get started with my first Inkscape flowchart.
Getting my first rectangle on the screen was pretty straightforward with the Create Rectangles and Squares toolbar item. I changed the shape's background color by using the color swatches across the bottom of the screen. However, it seems text is separate from other objects, i.e., there doesn't appear to be a concept of geometric objects with annotation, so I created the text first, then added the surrounding object, and finally put in connectors. Default text sizes were odd (30pt, if I recall correctly) but you can change the default. Bottom line: I could make the diagram, but—based on what I could learn in a few minutes—it was more of a diagram than a flowchart.
In general terms, Inkscape is an extremely full-featured vector drawing program with a learning curve. It's probably not the best tool for users who just want to draw a quick flowchart. There seems to be a spell checker available, although I didn't try it.
Calligra Flow
From the Calligra website:
Calligra Flow is an easy to use diagramming and flowcharting application with tight integration to the other Calligra applications. It enables you to create network diagrams, organisation charts, flowcharts, and more.
I could not find Calligra Flow in my repositories. Because of that and its tight integration with Calligra, which is oriented toward KDE users, I decided not to review it now. Based on its website, it looks like it's geared toward flowcharting, which could make it a good choice if you're using KDE.
Diagramo
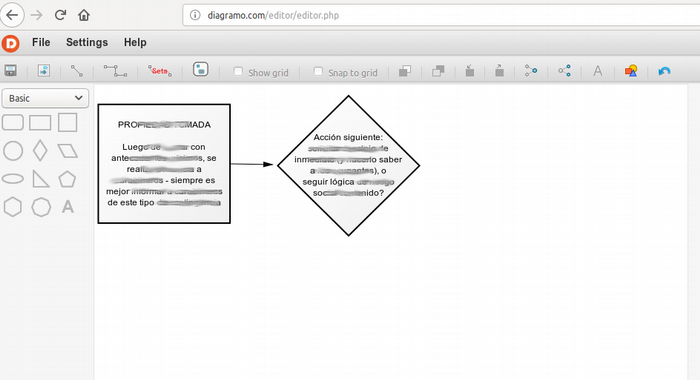
I reviewed Diagramo build number 2.4.0-3c215561787f-2014-07-01, accessed through Try It Now! on the Diagramo website using the Firefox browser.
Diagramo is standalone, web-based flowcharting software. It claims to be pure HTML5 and GPL, but the source code repository states the code is available under the Apache License 2.0.
The tool is accessible through a web browser, so no installation is required. (I didn't download the source code and try to install it locally.)
I couldn't find any documentation for Diagramo. The application's Help button allows bug filing and turning on the debugger, and the build number is available under About.
Diagramo offers several collections of drawing objects: Basic, Experimental, Network, Secondary, and UML State Machine. I limited my testing to the Basic set, which contained enough objects for me. To create a chart, you drag objects from the menu on the left and drop them on the canvas. You can set the canvas size in the options panel on the right. Sizes are in pixels, which is OK, although I prefer to work in points. The default text attributes were: 12px, Arial font, center alignment, with options to underline and change the text color. You can see the attributes in a popup menu above the text by double-clicking the default annotation, which is set to Text. You have to manually break lines of text, similar to in LibreOffice Draw. Objects have multiple connection points (I counted 12 on the rectangles and five on the diamonds). Connectors are separate from shapes and appear in the top toolbar. I couldn't save my test flowchart to my computer.
In general terms, Diagramo provides good basic flowcharting capability with no UX surprises. It performs well, at least on smaller flowcharts, but doesn't seem to take advantage of Firefox's spell checker.
Pencil
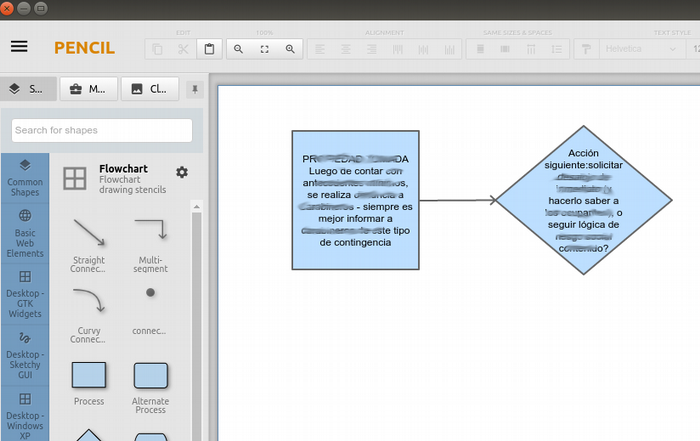
I reviewed Pencil version 3.0.4, which I downloaded from the Pencil project website. I used dpkg to install the 64-bit .deb package file. It installed cleanly with no missing packages.
Pencil is a standalone drawing tool. Documentation and tutorials are available on the project website.
To make my sample flowchart, I selected the flowchart shape set from the far-left menu panel. From there, I could drag Process, Decision, and Straight Connector shapes onto the page. I added annotation by double-clicking on the object and typing in the text. (Copy/paste also works.) You can drag the connector endpoints near the desired attachment point and they automatically attach. The default font setting (Arial, 12pt) is a good choice, but I couldn't find a spell check function.
In general, using Pencil is very simple and straightforward. It offers solid flowcharting capability with no UX surprises and performs well, at least on smaller flowcharts.
Graphviz
According to the Graphviz documentation:
The Graphviz layout programs take descriptions of graphs in a simple text language and make diagrams in useful formats, such as images and SVG for web pages; PDF or Postscript for inclusion in other documents; or display in an interactive graph browser. Graphviz has many useful features for concrete diagrams, such as options for colors, fonts, tabular node layouts, line styles, hyperlinks, and custom shapes.
I didn't do a full review of Graphviz. It looks like a very interesting package for converting text to graphical representations, and I might try it at some point. However, I don't see it as a good tool for people who are used to a more interactive UX. If you'd like to know more about it, Stack Overflow offers a quick overview of constructing a simple flowchart in Graphviz.
Umbrello
I spotted Umbrello in my repositories, where I read:
Umbrello UML Modeller is a Unified Modelling Language diagram editor for KDE. It can create diagrams of software and other systems in the industry-standard UML format, and can also generate code from UML diagrams in a variety of programming languages. This package is part of the KDE Software Development Kit module.
Because of its focus on UML rather than flowcharting and its KDE orientation, I decided to leave Umbrello to evaluate later.
Draw.io
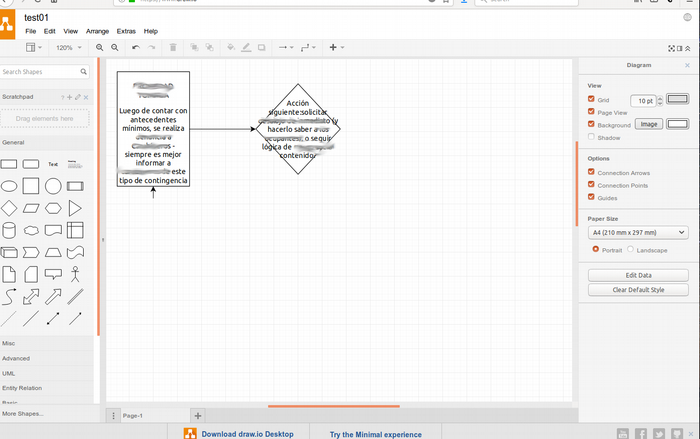
I reviewed Draw.io version 8.9.7, which I accessed through its website.
Draw.io is standalone, web-based drawing software, and a desktop version is available. Since it runs in the browser, there's no installation required.
Documentation is available on the Draw.io website.
Draw.io launches with a set of general flowchart drawing objects on the left and context-sensitive properties on the right. (It's reminiscent of the Properties window in LibreOffice.) Clicking on a shape makes it appear on the page. Text defaults to centered 12pt Helvetica. Double-clicking on the drawing object opens the annotation editor. Draw.io automatically splits long lines of text, but the splitting isn't perfect in the diamond object. Objects have a decent number of connection points (I count 12 on the rectangle and eight on the diamond). Similar to Google Draw, as objects are dragged around, alignment aids help square up the diagram. I saved my work to an .xml file on my computer, which is a cool option for a web-based service. Diagrams can also be shared.
In general terms, Draw.io provides solid flowcharting capability with no UX surprises, but no spell checker that I could find. It performs well, at least on smaller flowcharts, and the collaboration ability is nice.
What's the verdict?
So, which of these flowcharting tools do I like best?
Bearing in mind that I was leaning toward a standalone tool that could operate on any desktop, Draw.io and Diagramo appealed to me for their simplicity and browser-based operation (which means no installation is necessary). I also really liked Pencil, although it must be installed.
Conversely, I felt Dia's UX was just a bit clunky and old-fashioned, although it certainly has great functionality.
LibreOffice Draw and Calligra Flow, due to their integration in their respective office suites, didn't achieve my goal for a standalone, lightweight tool.
Inkscape, Graphviz, and Umbrello seem like great tools in their own right, but trying to use them as simple, standalone flowchart creation tools seems like a real stretch.
Will any of these replace G Suite's drawing capability in our office? I think Draw.io, Diagramo and Pencil could. We shall see!




17 Comments