Monitoring network activity can be a tedious job, but there are good reasons to do it. For one, it allows you to find and investigate suspicious logins on workstations, devices connected to networks, and servers while identifying sources of administrator abuse. You can also trace software installations and data transfers to identify potential issues in real time rather than after the damage is done.
Those logs also go a long way towards keeping your company in compliance with the General Data Protection Regulation (GDPR) that applies to any entity operating within the European Union. If you have a website that is viewable in the EU, you qualify.
Logging—both tracking and analysis—should be a fundamental process in any monitoring infrastructure. A transaction log file is necessary to recover a SQL server database from disaster. Further, by tracking log files, DevOps teams and database administrators (DBAs) can maintain optimum database performance or find evidence of unauthorized activity in the case of a cyber attack. For this reason, it's important to regularly monitor and analyze system logs. It's a reliable way to re-create the chain of events that led up to whatever problem has arisen.
There are quite a few open source log trackers and analysis tools available today, making choosing the right resources for activity logs easier than you think. The free and open source software community offers log designs that work with all sorts of sites and just about any operating system. Here are five of the best I've used, in no particular order.
Graylog
Graylog started in Germany in 2011 and is now offered as either an open source tool or a commercial solution. It is designed to be a centralized log management system that receives data streams from various servers or endpoints and allows you to browse or analyze that information quickly.
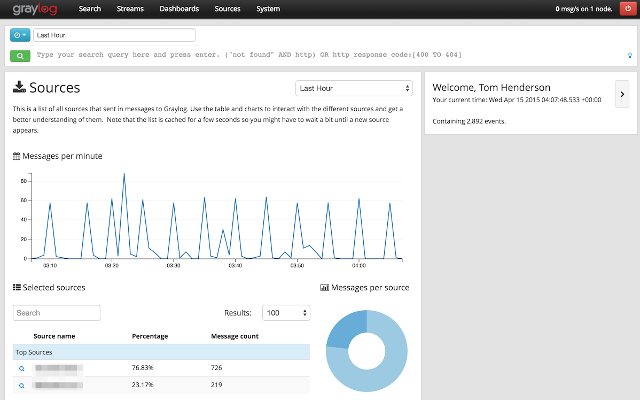
Graylog has built a positive reputation among system administrators because of its ease in scalability. Most web projects start small but can grow exponentially. Graylog can balance loads across a network of backend servers and handle several terabytes of log data each day.
IT administrators will find Graylog's frontend interface to be easy to use and robust in its functionality. Graylog is built around the concept of dashboards, which allows you to choose which metrics or data sources you find most valuable and quickly see trends over time.
When a security or performance incident occurs, IT administrators want to be able to trace the symptoms to a root cause as fast as possible. Search functionality in Graylog makes this easy. It has built-in fault tolerance that can run multi-threaded searches so you can analyze several potential threats together.
Nagios
Nagios started with a single developer back in 1999 and has since evolved into one of the most reliable open source tools for managing log data. The current version of Nagios can integrate with servers running Microsoft Windows, Linux, or Unix.
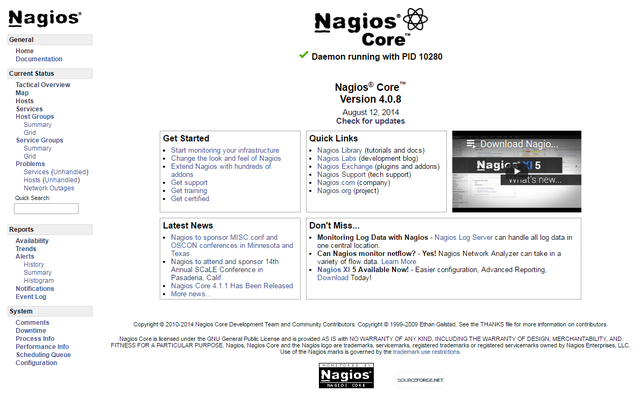
Its primary product is a log server, which aims to simplify data collection and make information more accessible to system administrators. The Nagios log server engine will capture data in real-time and feed it into a powerful search tool. Integrating with a new endpoint or application is easy thanks to the built-in setup wizard.
Nagios is most often used in organizations that need to monitor the security of their local network. It can audit a range of network-related events and help automate the distribution of alerts. Nagios can even be configured to run predefined scripts if a certain condition is met, allowing you to resolve issues before a human has to get involved.
As part of network auditing, Nagios will filter log data based on the geographic location where it originates. That means you can build comprehensive dashboards with mapping technology to understand how your web traffic is flowing.
Elastic Stack (the "ELK Stack")
Elastic Stack, often called the ELK Stack, is one of the most popular open source tools among organizations that need to sift through large sets of data and make sense of their system logs (and it's a personal favorite, too).

Its primary offering is made up of three separate products: Elasticsearch, Kibana, and Logstash:
-
As its name suggests, Elasticsearch is designed to help users find matches within datasets using a wide range of query languages and types. Speed is this tool's number one advantage. It can be expanded into clusters of hundreds of server nodes to handle petabytes of data with ease.
-
Kibana is a visualization tool that runs alongside Elasticsearch to allow users to analyze their data and build powerful reports. When you first install the Kibana engine on your server cluster, you will gain access to an interface that shows statistics, graphs, and even animations of your data.
-
The final piece of ELK Stack is Logstash, which acts as a purely server-side pipeline into the Elasticsearch database. You can integrate Logstash with a variety of coding languages and APIs so that information from your websites and mobile applications will be fed directly into your powerful Elastic Stalk search engine.
A unique feature of ELK Stack is that it allows you to monitor applications built on open source installations of WordPress. In contrast to most out-of-the-box security audit log tools that track admin and PHP logs but little else, ELK Stack can sift through web server and database logs.
Poor log tracking and database management are one of the most common causes of poor website performance. Failure to regularly check, optimize, and empty database logs can not only slow down a site but could lead to a complete crash as well. Thus, the ELK Stack is an excellent tool for every WordPress developer's toolkit.
LOGalyze
LOGalyze is an organization based in Hungary that builds open source tools for system administrators and security experts to help them manage server logs and turn them into useful data points. Its primary product is available as a free download for either personal or commercial use.
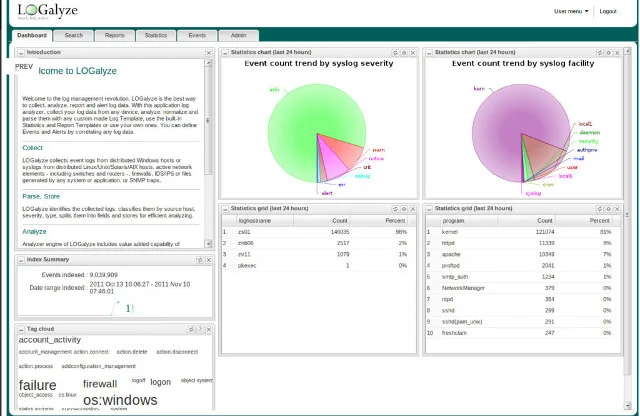
LOGalyze is designed to work as a massive pipeline in which multiple servers, applications, and network devices can feed information using the Simple Object Access Protocol (SOAP) method. It provides a frontend interface where administrators can log in to monitor the collection of data and start analyzing it.
From within the LOGalyze web interface, you can run dynamic reports and export them into Excel files, PDFs, or other formats. These reports can be based on multi-dimensional statistics managed by the LOGalyze backend. It can even combine data fields across servers or applications to help you spot trends in performance.
LOGalyze is designed to be installed and configured in less than an hour. It has prebuilt functionality that allows it to gather audit data in formats required by regulatory acts. For example, LOGalyze can easily run different HIPAA reports to ensure your organization is adhering to health regulations and remaining compliant.
Fluentd
If your organization has data sources living in many different locations and environments, your goal should be to centralize them as much as possible. Otherwise, you will struggle to monitor performance and protect against security threats.
Fluentd is a robust solution for data collection and is entirely open source. It does not offer a full frontend interface but instead acts as a collection layer to help organize different pipelines. Fluentd is used by some of the largest companies worldwide but can be implemented in smaller organizations as well.
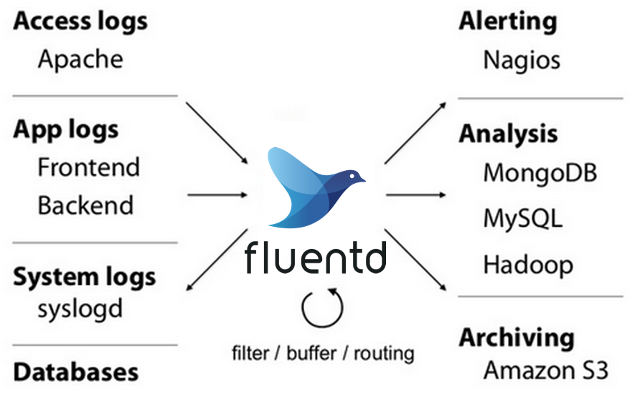
The biggest benefit of Fluentd is its compatibility with the most common technology tools available today. For example, you can use Fluentd to gather data from web servers like Apache, sensors from smart devices, and dynamic records from MongoDB. What you do with that data is entirely up to you.
Fluentd is based around the JSON data format and can be used in conjunction with more than 500 plugins created by reputable developers. This allows you to extend your logging data into other applications and drive better analysis from it with minimal manual effort.
The bottom line
If you aren't already using activity logs for security reasons, governmental compliance, and measuring productivity, commit to changing that. There are plenty of plugins on the market that are designed to work with multiple environments and platforms, even on your internal network. Don't wait for a serious incident to justify taking a proactive approach to logs maintenance and oversight.



Comments are closed.