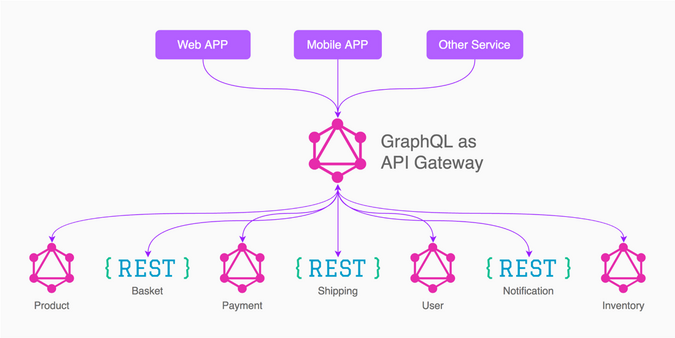
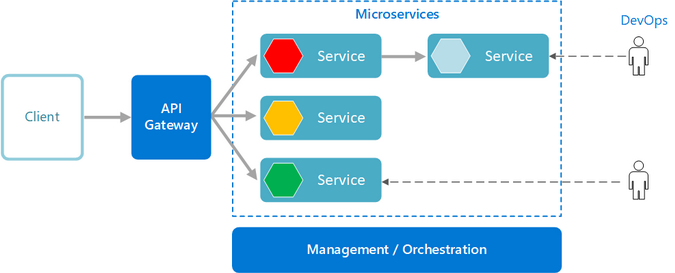
Microservices and GraphQL are a great combination, like bread and butter. They're both great on their own and even better together. Knowing the health of your microservices is important because they run important services—it would be foolish to wait until something critical breaks before diagnosing a problem. It doesn't take much effort to let GraphQL help you detect issues early.

Routine health checks allow you to watch and test your services to get early notifications about problems before they affect your business, clients, or project. That's easy enough to say, but what does it really mean to do a health check?
Here are the factors I think about when designing a service checkup:
Requirements for a server health check:
- I need to understand the availability status of my microservice.
- I want to be able to manage the server load.
- I want end-to-end (e2e) testing of my microservices.
- I should be able to predict outages.

Ways to do server health checks
Coming up with health checks can be tricky because, in theory, there's nearly an infinite number of things you could check for. I like to start small and run the most basic test: a ping test. This simply tests whether the server running the application is available. Then I ramp up my tests to evaluate specific concerns, thinking about the elements of my server that are most important. I think about the things that would be disastrous should they disappear suddenly.
- Ping check: Ping is the simplest monitor type. It just checks that your application is online.
- Scripted browser: Scripted browsers are more advanced; browser automation tools like Selenium enable you to implement custom monitoring rule sets.
- API tests: API tests are used to monitor API endpoints. This is an advanced version of the ping check model, where you can define the monitoring plan based on the API responses.
Health check with GraphQL
In a typical REST-based microservice, you need to build health check features from scratch. It's a time-intensive process, but it's not something you have to worry about with GraphQL.
According to its website:
"GraphQL is a query language for APIs and a runtime for fulfilling those queries with your existing data. GraphQL provides a complete and understandable description of the data in your API, gives clients the power to ask for exactly what they need and nothing more, makes it easier to evolve APIs over time, and enables powerful developer tools."
When you bootstrap a GraphQL microservice, you also get a provision to monitor the health of the microservice. This is something of a hidden gem.
As I mentioned above, you can perform API tests as well as ping checks with the GraphQL endpoint.
Apollo GraphQL Server provides a default endpoint that returns information about your microservices and server health. It's not very complex: it returns status code 200 if the server is running.
The default endpoint is <server-host>/.well-known/apollo/server-health.

Advanced health checks
In some cases, basic health checks may not be enough to ensure the integrity of a system. For example, tightly coupled systems require more business logic to ensure the health of the system.
Apollo GraphQL is efficient enough to manage this use case by declaring an onHealthCheck function while defining the server:
* Defining the Apollo Server */
const apollo = new ApolloServer({
  playground: process.env.NODE_ENV !== 'production',
  typeDefs: gqlSchema,
  resolvers: resolver,
  onHealthCheck: () => {
    return new Promise((resolve, reject) => {
      // Replace the `true` in this conditional with more specific checks!
      if (true) {
        resolve();
      } else {
        reject();
      }
    });
  }
});
When you define an onHealthCheck method, it returns a promise that resolves if the server is ready and rejects if there is an error.
GraphQL makes monitoring APIs easier. In addition, using it for your server infrastructure makes things scalable. If you want to try adopting GraphQL as your new infrastructure definition, see my GitHub repo for example code and configuration.


Comments are closed.