Data is beautiful. As a #CitizenScientist, I enjoy gathering data and trying to make sense of the world around me. At work, we use Prometheus to gather metric data from our clusters, and at home, I use Prometheus to gather data from my hobbies. This article explores how to take an application—a Python script that gathers temperature and humidity data from a sensor—and instrument it to provide data in a model that Prometheus can gather. I'll also create a systemd service to start and manage the application.
What is Prometheus?
Prometheus is an open source monitoring and alerting system that gathers metrics and provides a powerful query language for exploring data. I've written about setting up Prometheus locally at home. Prometheus is frequently used to gather data from container orchestration clusters such as Kubernetes and OpenShift.
In my job as a site reliability engineer running OpenShift Dedicated clusters for Red Hat, Prometheus is the core of a robust monitoring and alerting system for all of our clusters, operators, and applications. It is used at huge scale by large enterprise organizations, but it is equally at home, well, at home, collecting data for hobbyist projects.
In my previous article about using a Raspberry Pi Zero and DHT22 to collect temperature and humidity data, I showed how to write a Python script to gather the data and print it to the screen. That is good for checking the data manually for each moment, but it would be far more useful for me to gather and store the data to examine it historically. This is where Prometheus shines as a time-series database with its own query language and graph capabilities.
Instrument the app for Prometheus
In a nutshell, instrumenting the application for Prometheus requires taking the data from the sensor, labeling it, and serving it as text over HTTP so that Prometheus can find and store the data. Prometheus will check these text pages, or "targets," at a specified interval, looking for updates to the data. So, the application will need to update the target metrics as new sensor data is received.
The format of the data exposed for Prometheus to gather consists of a key (a metric name—that which is being measured) and a value separated by a space:
dht22_temperature{scale="fahrenheit"} 84.01999931335449Prometheus also supports optional labels to make it easier to filter and aggregate data. This application uses labels to differentiate between Celsius and Fahrenheit scales for the dht22_temperature metric. The {scale="fahrenheit"} is the label in the example above. Check out the Prometheus data model for more details.
You can modify the script manually to set up a web server and print the sensor data, but Prometheus provides a Prometheus Python client that makes the process considerably easier. You can install the client using the pip Python package manager. If you don't already have it, install pip using your distribution's package manager, and then use it to install prometheus-client. I'm running Raspberry Pi OS on my sensor system, so I'll use apt-get, but substitute your package manager of choice:
# Install pip
sudo apt-get install pip3

# Install prometheus-client
sudo pip3 install prometheus-client
Next, you need to tweak the previous article's sensor script to store the sensor data as Prometheus gauges. A gauge is "a metric that represents a single numerical value that can arbitrarily go up and down," as opposed to, say, a counter, which only goes up. Prometheus has many different metric types. A gauge is perfect to represent temperature and humidity data.
Gauges are provided by the prometheus_client.Gauge module, so you need to import the module before you can use gauges in the script. Because start_http_server is used later to display the metrics via HTTP, import that now as well:
# Import Gauge and start_http_server from prometheus_client
from prometheus_client import Gauge, start_http_server
Next, create the gauges to store the humidity and temperature data. The ['scale'] bit adds the "scale" label for the temperature gauge. Then the gauge is initialized with both celsius and fahrenheit values for the label:
# Create Prometheus gauges for humidity and temperature in
# Celsius and Fahrenheit
gh = Gauge('dht22_humidity_percent',
           'Humidity percentage measured by the DHT22 Sensor')
gt = Gauge('dht22_temperature',
           'Temperature measured by the DHT22 Sensor', ['scale'])

# Initialize the labels for the temperature scale
gt.labels('celsius')
gt.labels('fahrenheit')
You can set the gauges with the sensor data when checking the sensor:
    try:
        # Get the sensor data
        humidity, temperature = Adafruit_DHT.read_retry(SENSOR, SENSOR_PIN)
    except RuntimeError as e:
        log.error("RuntimeError: {}".format(e))

    if humidity is not None and temperature is not None:
        # Update the gauge with the sensor data
        gh.set(humidity)
        gt.labels('celsius').set(temperature)
        gt.labels('fahrenheit').set(celsius_to_fahrenheit(temperature))
This is done inside a while True: loop (not shown above; see the full script below) to continually update the gauges with data from the sensor.
Finally, Prometheus' start_metrics_server will serve the collected metrics via HTTP. This is called before the while loop so that the server starts first:
    # Start the Prometheus metrics server to display the metrics data
    metrics_port = 8000
    start_http_server(metrics_port)
With all this together, the script should look something like this:
#!/usr/bin/env python3

import logging
import time

import Adafruit_DHT

from prometheus_client import Gauge, start_http_server
from systemd.journal import JournalHandler

# Setup logging to the Systemd Journal
log = logging.getLogger('dht22_sensor')
log.addHandler(JournalHandler())
log.setLevel(logging.INFO)

# Initialize the DHT22 sensor
# Read data from GPIO4 pin on the Raspberry Pi
SENSOR = Adafruit_DHT.DHT22
SENSOR_PIN = 4

# The time in seconds between sensor reads
READ_INTERVAL = 30.0

# Create Prometheus gauges for humidity and temperature in
# Celsius and Fahrenheit
gh = Gauge('dht22_humidity_percent',
           'Humidity percentage measured by the DHT22 Sensor')
gt = Gauge('dht22_temperature',
           'Temperature measured by the DHT22 Sensor', ['scale'])

# Initialize the labels for the temperature scale
gt.labels('celsius')
gt.labels('fahrenheit')

def celsius_to_fahrenheit(degrees_celsius):
        return (degrees_celsius * 9/5) + 32

def read_sensor():
    try:
        humidity, temperature = Adafruit_DHT.read_retry(SENSOR, SENSOR_PIN)
    except RuntimeError as e:
        # GPIO access may require sudo permissions
        # Other RuntimeError exceptions may occur, but
        # are common.  Just try again.
        log.error("RuntimeError: {}".format(e))

    if humidity is not None and temperature is not None:
        gh.set(humidity)
        gt.labels('celsius').set(temperature)
        gt.labels('fahrenheit').set(celsius_to_fahrenheit(temperature))

        log.info("Temp:{0:0.1f}*C, Humidity: {1:0.1f}%".format(temperature, humidity))

    time.sleep(READ_INTERVAL)

if __name__ == "__main__":
    # Expose metrics
    metrics_port = 8000
    start_http_server(metrics_port)
    print("Serving sensor metrics on :{}".format(metrics_port))
    log.info("Serving sensor metrics on :{}".format(metrics_port))

    while True:
        read_sensor()
Set up the systemd unit and logging
The script is ready to go and would work with Prometheus as it is. But I'm running this on headless (i.e., no monitor, keyboard, etc.) Raspberry Pi Zero Ws installed in project boxes with DHT22 sensors, set up in different rooms of the house. I'll add a systemd service to automatically start the script at boot and make sure it keeps running. I'll also take advantage of the systemd journal and send log data from the script (e.g., startup or error messages) to the journal.
The systemd service will be a separate file systemd uses, but it needs the python3-systemd package to send logs to the journal from the script. You can install it with apt-get (or your package manager):
# Install the python3-systemd package for Journal integration
sudo apt-get install python3-systemd
You can configure the Python logger within the service monitor script to send logs to the journal by using the systemd.journal.JournalHandler module. After importing it, you can add the JournalHandler as a handler for the logger:
from systemd.journal import JournalHandler

# Setup logging to the Systemd Journal
log = logging.getLogger('dht22_sensor')
log.addHandler(JournalHandler())
log.setLevel(logging.INFO)
Now it can log to the journal with log.info(). For example:
# This will send the message to the Systemd Journal,
# and show up in `systemctl status` and with `journalctl`
log.info("Serving sensor metrics on :{}".format(metrics_port))
With the script updated to log to the systemd journal, create a systemd service for the sensor-metrics.py script:
# /etc/systemd/system/sensor-metrics.service
[Unit]
Description=DHT22 Sensor Metrics Service
After=network.target
StartLimitIntervalSec=0

[Service]
Type=simple
Restart=always
ExecStart=python3 /opt/sensor-metrics/sensor-metrics.py

[Install]
WantedBy=multi-user.target
This merely tells systemd to look for a script in /opt/sensor-metrics/sensor-metrics.py, start it, and keep it running. This will become the sensor-metrics service.
Link (or move, if you prefer) the sensor-metrics.py script to /opt/sensor-metrics/sensor-metrics.py:
# Create /opt/sensor-metrics and link the sensor-metrics.py script from the current directory into it
sudo mkdir /opt/sensor-metrics
sudo ln -s $(pwd)/sensor-metrics.py /opt/sensor-metrics/
Link the sensor-metrics.service file to /etc/systemd/system:
# Link the sensor-metrics.service file into the Systemd directory
sudo ln -s $(pwd)/sensor-metrics.service /etc/systemd/system/
Now you can enable the sensor-metrics service to start on boot and check the status:
# Enable and start the sensor-metrics.service
sudo systemctl enable sensor-metrics.service
sudo systemctl start sensor-metrics.service
Now the service is running and set to start on boot.
To find out if everything is running, check the service status with systemctl:
sudo systemctl status sensor-metrics.serviceYou should see something like this (if everything is working):
● sensor-metrics.service - DHT22 Sensor Metrics Service
   Loaded: loaded (/home/chris/sensor-metrics.service; enabled; vendor preset: enabled)
   Active: active (running) since Wed 2021-06-30 03:33:02 BST; 8s ago
 Main PID: 4129 (python3)
    Tasks: 2 (limit: 877)
   CGroup: /system.slice/sensor-metrics.service
           └─4129 /usr/bin/python3 /opt/sensor-metrics/sensor-metrics.py

Jun 30 03:33:02 cumulo systemd[1]: Started DHT22 Sensor Metrics Service.
Jun 30 03:33:05 cumulo /opt/sensor-metrics/sensor-metrics.py[4129]: Serving sensor metrics on :8000
Jun 30 03:33:05 cumulo /opt/sensor-metrics/sensor-metrics.py[4129]: Temp:30.6*C, Humidity: 47.1%
Success!
Check the metrics target
With the service running and the script modified to collect sensor data in gauges and display it for Prometheus, you can view the data as Prometheus will.
In a browser, navigate to https://<IP OF YOUR HOST>:8000, substituting the IP address of the machine running the sensor-metrics service.
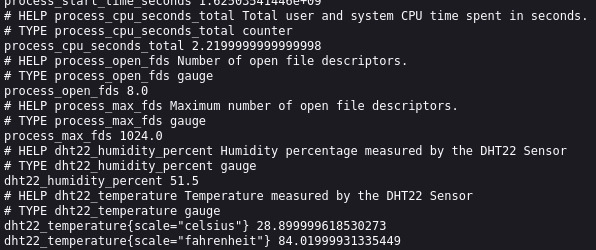
You should see a page with several metrics about the Python client (bonus!), as well as the dht22_temperature and dht22_humidity metrics. It should look something like this:

(Chris Collins, CC BY-SA 4.0)
Data really IS beautiful! Look at that! Humidity and temperature in two different scales!
The data will update each time the service script checks the sensor data. Now for the last step: showing Prometheus where to look for all this data.
Create a Prometheus scrape config
Before moving on, I recommend you read my earlier article about running Prometheus at home and have an instance already set up. If you haven't, go ahead and do that now (and tell all your friends what a great experience it was). The article shows how to set up Prometheus to read dynamic scrape configs from a file and reload automatically. These scrape configs point Prometheus to the metric data targets it should ingest (i.e., "scrape").
Add a scrape config for the sensor-metrics data to the array (if any) in the scrape config JSON setup in the previous article. Note the array below has the single Prometheus sensor-metrics target. Yours may already have other targets. Just add to the list.
// This scrape config target points to the IP Address of the Raspberry Pi and the Port used in the sensor-metrics.py script
// Substitute your own IP and the port you chose
[
  {"labels": {"job": "dht22"}, "targets": ["192.168.1.119:8000"]}
]
After restarting Prometheus (or waiting for it to find and load the new scrape config), Prometheus will begin looking for metrics data at the target you specified above.
Bringing it all together
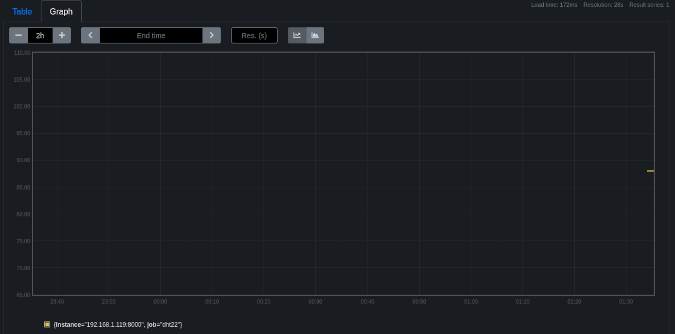
Finally, everything is running, and you can look at the data you're collecting! Open the Prometheus web interface for your Prometheus server. Mine is https://localhost:9090/graph, and yours may be the same if you followed along with the previous article. Click on the "graph" tab, and search for dht22_temperature{scale=~"fahrenheit"} to see the temperature data being collected.

(Chris Collins, CC BY-SA 4.0)
Well. That's disappointing.
OK, so, two things:
- Time-series data is underwhelming at first because you don't have much data yet. It gets better over time.
- Ambient temperature data takes a somewhat longer period to display anything interesting because it doesn't change much.
So, give it time. Eventually, it'll look much more interesting and get better:

(Chris Collins, CC BY-SA 4.0)
MUCH better!
Do some #CitizenScience
Prometheus works very well for collecting metric data, storing it as time-series data, and providing a way to explore it. I hope this article has inspired you to perform some #CitizenScience at home, create your own data, and explore!


Comments are closed.