The new open source project tomviz is helping the 3D visualization of nanotechnology.
Modern computers are built with nanotechnology. A processor contains billions of transistors, each around 14 nanometers. A single bit of information on a hard disc drive is confined to a 10 nanometer domain spinning on a disc 75 miles per hour. The accelerometers in our smartphones contain nano-springs that measure gravitational forces to determine orientation.
Computing is nanoscience and programmers use it in every line of code.
However we cannot directly see nanotechnology. A nanometer is 7,000 times smaller than the red blood cells in your body—residing at a scale where the wavelengths of light are too large to measure its existence. To see nanoscale objects, high-energy electrons are needed. An electron microscope utilizes a beam of electrons capable of resolving each individual atom in a material.
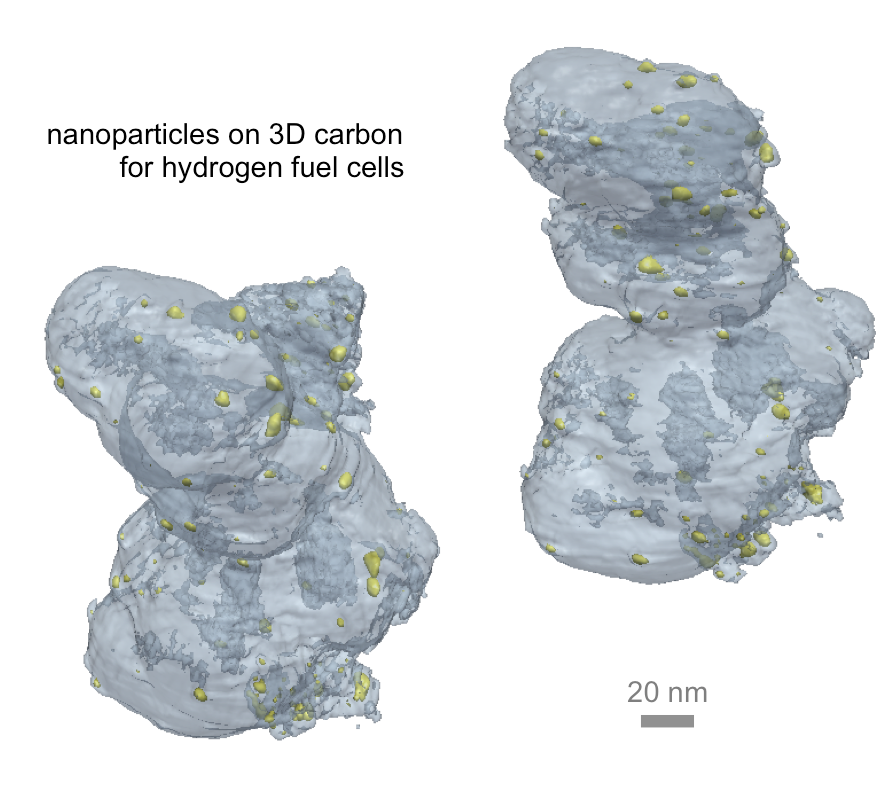
3D imaging of nanomaterials is necessary for developing a wide range of new technologies, including the hydrogen fuel cells used in clean energy vehicles.
3D imaging of nanomaterials is necessary for developing a wide range of new technologies, including the hydrogen fuel cells used in clean energy vehicles.
Recently, imaging nanoscale objects in all three-dimensions (3D) has become an important task. In the context of computing, novel devices—such as the FINFET transistor—are being fabricated with complex 3D structure. Improving computing speeds and upholding Moore’s law requires complete characterization in all dimensions.
An electron microscope can image nanotechnology in 3D with an experimental technique known as electron tomography. Conceptually similar to a medical CT scan—only performed at the nanoscale—a series of projection images taken around the specimen allows complete volumetric reconstruction of an object. However, it is a complex process that relies heavily on software for every step of the process, from 3D reconstruction to visualization. For electron tomography, little to no software exists and an open-source platform is desperately needed.
This year a grant from the US Department of Energy kickstarted the tomviz project for advanced tomographic reconstruction and visualization of nanotechnology. In this user-friendly, cross-platform application, large volumetric datasets can be rendered, animated, sliced, and analyzed. The platform provides a robust graphical interface where multiple datasets, colormaps, and other visualization settings can be used in combination and these objects can be saved as image or animated video files. Data collected can be further analyzed through histograms, multicorrelative statistics, multiple filters, and user-customized python scripts. Tomographic reconstructions of experimental data is also possible within tomviz.
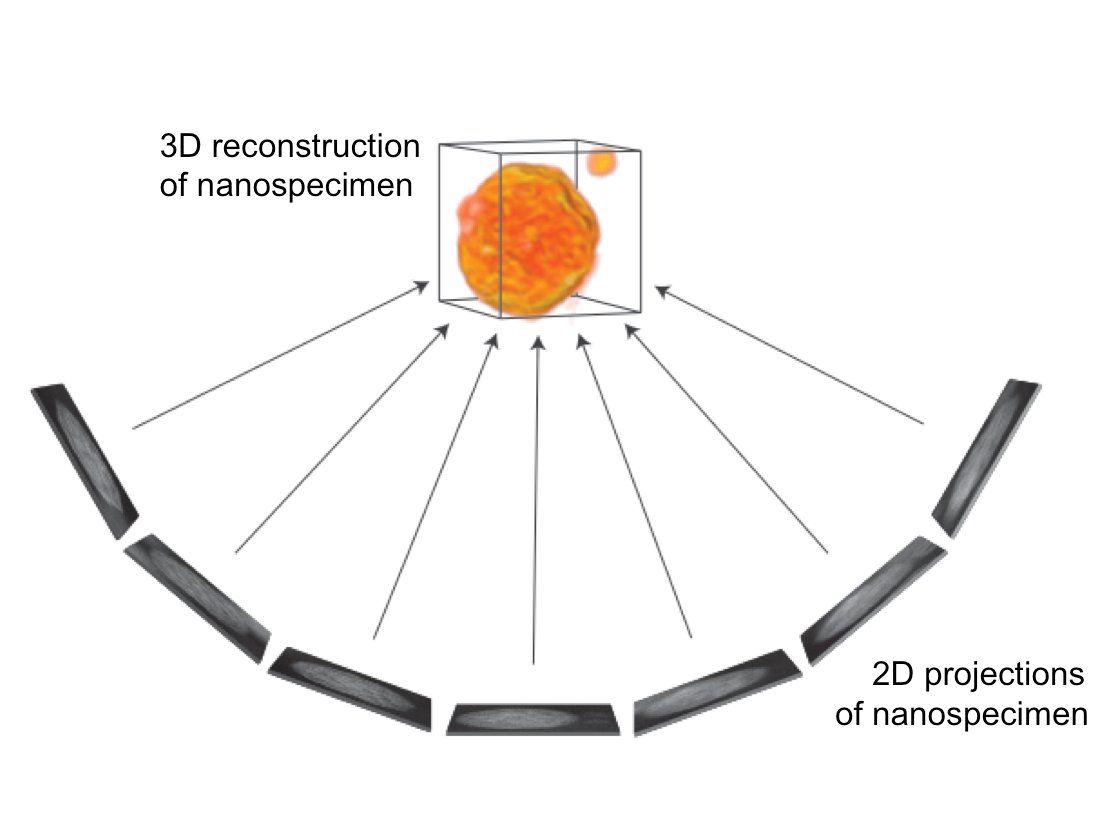
Electron tomography uses many projection images to reconstruct a nanoscale object in 3D.
Electron tomography uses many projection images to reconstruct a nanoscale object in 3D.
In the context of visualization, the transparency and repeatability of open source software is important to open science. When publishing 3D scientific data, the final representation is subjective to the filters and thresholds chosen by the user. Even with equal access to a dataset it can be difficult to reproduce the 3D visualizations appearing in scientific journals. Ensuring the reproducibility of tomographic analysis requires an open visualization platform capable of saving the workspace and data processing pipelines.
tomviz supports open science through release under a BSD license. Allowing widespread distribution for any use—academic, industrial, or educational.
With tomviz, 3D reconstructions and visualizations become accessible to everyone. Through the use of state/trace files the application offers the capability to unambiguously save the workflow pipeline to a file referencing all input data. This enables fully reproducible results—having significant implications for fields where researchers share data with colleagues or raise queries with experts. These pipeline files can aid the publication of results and improve open scientific methods.
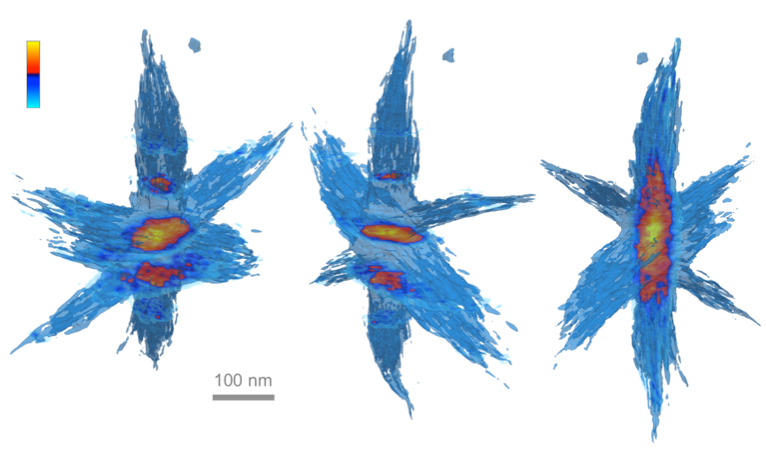
tomviz can reconstruct and visualize complex objects such as this hyperbranched nanoparticle. Slices taken through the nanoparticle appear as bright orange and highlight the inner core of the particle.
tomviz can reconstruct and visualize complex objects such as this hyperbranched nanoparticle. Slices taken through the nanoparticle appear as bright orange and highlight the inner core of the particle.
In its final form, tomviz will become a complete toolset for 3D imaging of nanomaterials—from reconstruction to visualization. Utilizing open source 3D libraries (VTK and ParaView) the nascent project provides a necessary tool for tomographic data analysis. Python with NumPy interfaces will enable easy implementation and sharing of complex data processing and reconstruction methods developed by researchers. To accompany the software datasets of real nanotechnology will be released under a Creative Commons license in order to showcase the platform and encourage new developments the field.
Scientists, programmers, and the curious can download compiled versions of tomviz. Developers can access the source code on GitHub.
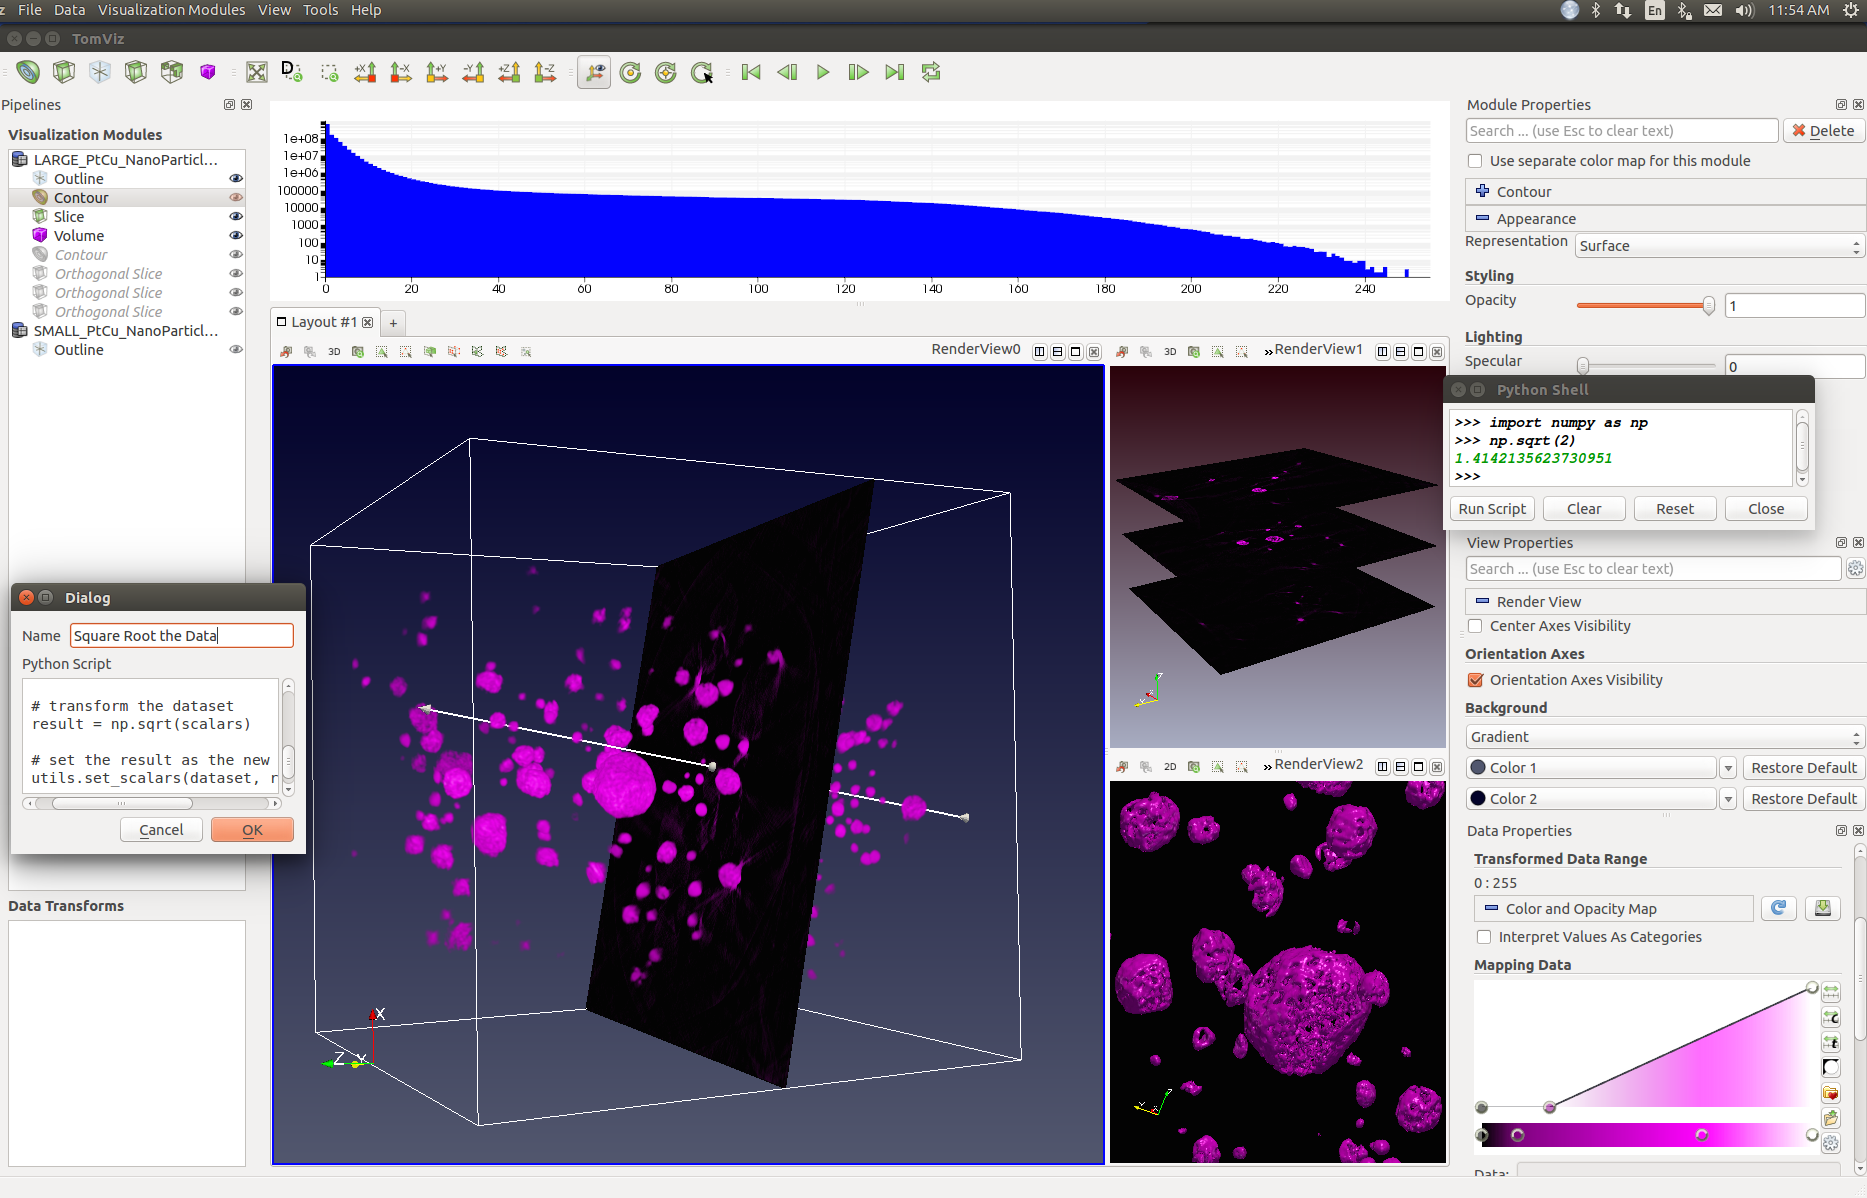
Screenshot of the tomviz v0.2 graphical interface.
Screenshot of the tomviz v0.2 graphical interface.
Acknowledgements
The tomviz project is made possible by the DOE Office of Science, SBIR #DE-SC0011385. Also thanks to VTK and Paraview for providing a foundation of useful source code. Thanks to Elliot Padgett for nanocatalyst dataset; Robinson group for the hyperbranched particle; FIJI and serialEM for making great open science image tools for microscopy.






1 Comment