If you are interested in measuring and interacting with the world around you through the Internet of Things (IoT), there are a variety of inexpensive microcontrollers and microcomputers you can use. There are also many sensors available that connect to these devices to measure many aspects of the physical world.
These sensors interface with the microcontroller boards using the I2C message bus, which programs that run on the boards can access using open source libraries in MicroPython, Java, C#, and other popular programming languages. These devices and libraries make it very easy to create sophisticated data-collection systems.
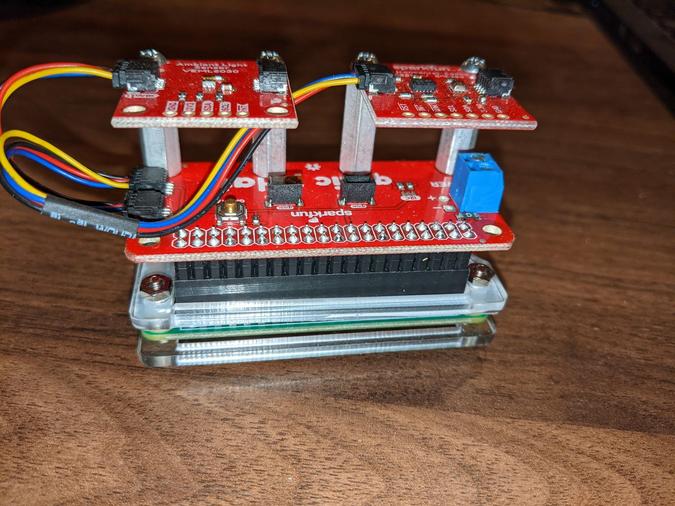
To demonstrate how easy and powerful this is, I built a greenhouse monitoring system using the following components that I purchased from SparkFun:
- Raspberry Pi Zero W with headers
- Power supply
- Qwiic pHAT
- Qwiic cables
- Qwiic Environmental Combo breakout
- Qwiic ambient light detector
- 32GB microSD card
- Metal standoffs, screws, and nuts
Adafruit has very similar offerings and connection systems.
Getting to know Prometheus
One of the first things you can do to start interacting with your world is to collect and analyze data acquired by sensors. Open source software makes it easy to collect, analyze, display, and even take action on your data.
The Prometheus family of applications makes it easy to collect, store, and analyze data as a time series of individual events. I will briefly introduce the relevant parts of the Prometheus architecture; if you would like to learn more, there are many great articles about Prometheus on Opensource.com, including An introduction to monitoring with Prometheus and Achieve high-scale application monitoring with Prometheus.
The Prometheus suite includes the following applications, which can be plugged together in various ways.
Prometheus
The main Prometheus service is a powerful time-series database that runs on a general-purpose computer, such as a Linux machine, cloud service, or Raspberry Pi (the Raspberry Pi 4 is recommended). A Prometheus instance can be configured to regularly "scrape" various file- and network-connected exporter services (e.g., HTTP, TCP, etc.) in the Prometheus exposition format. A single Prometheus service can be configured to scrape multiple targets, each with a unique job name. A scrape target publishes data in the form of events with a user-defined name, timestamp, value, and optional set of key-value annotations. If a data source publishes data without a timestamp, the scrape's exact time is automatically added to the event when it is stored. It can also be configured to communicate with one or more Alertmanager instances running on the same host or another host on the same network.
Once events are published in a Prometheus service, they can be queried using the Prometheus Query Language. PromQL queries can be used to create tables and graphs of events. They can also be used to configure alerts, whereby a PromQL query condition's truth causes the Prometheus service to set the configured alert's firing state as true; this alert will remain in the firing state as long as the condition is true. Once the condition becomes false, the alert firing state is set to false.
Multiple instances of an exporting service can publish the same metrics but differentiated by annotations to identify the sensor. For example, if you have three greenhouse monitors, each can publish its temperature, humidity, and other metrics, annotated with something like greenhouse=1, greenhouse=2, or greenhouse=3. Graphs, tables, and alerts can be configured to show all instances for a particular metric or just the metrics with specific annotations.
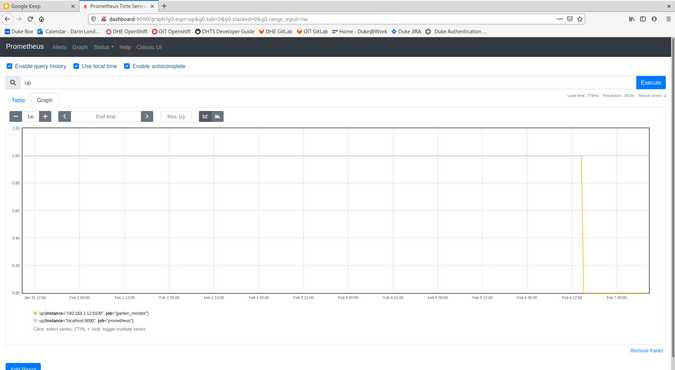
All metrics stored in Prometheus are annotated with the job defined for the scrape target in the configuration. Every scrape target configured in a Prometheus service has a Boolean metric called up, which is set to true each time the service successfully scrapes the target and false when it cannot. This is a useful metric to use in PromQL queries to define alerts when a service goes down.
Alertmanager
The main Prometheus service does not act on alerts—it just holds the alerts' state as firing or not firing at any particular moment. The Alertmanager service works with a Prometheus service to set up notifications when alerts defined in Prometheus are firing. One or more Alertmanager services can be configured to run on general-purpose computers on the same network as the Prometheus service.
Alertmanager notifications can be configured to communicate with various external systems, including email gateways, web service endpoints, chat services, and popular ticketing systems. Each notification can be templated to use various attributes about the event, including all of its annotations, to produce the notification message.
Node Exporter
Node Exporter is a very simple daemon that runs on a general-purpose computer host as a web service and exports data about that host via HTTP in the Prometheus exposition format. It is programmed to produce many different metrics about its host, such as CPU and memory utilization, using logic defined for each specific host architecture (e.g., proc filesystem, Windows Registry, etc.).
A Node Exporter instance can also be configured to present one or more Prometheus exposition format compliant files on the host filesystem. This makes it useful for publishing metrics produced by another application running on the same host. The example greenhouse monitoring system uses a Python program to collect data from the sensors and produce a Prometheus-formatted export file, and Node Exporter publishes these metrics.
Pushgateway
A Raspberry Pi Zero, 3, or 4 can host a Node Exporter, but other microcontrollers (such as an Arduino or Raspberry Pi Pico) cannot. Pushgateway enables these devices to publish their metrics. It is a microservice that can run on another general-purpose computer host (such as a desktop, a cloud, or even a Rasberry Pi Zero, 3, or 4) and present a prometheus exposition formatted feed for a Prometheus service to scrape, and a REST API that other processes connected to its network can use to report custom metrics.
A Pushgateway instance can run on the same host as the Prometheus service or a different host on the same network. If the microprocessor can communicate with the network using the Pushgateway and Prometheus services (e.g., an Ethernet cable, WiFi, or LoRaWAN), the process running on the microcontroller can use a standard HTTP library to report metrics using the Pushgateway REST API as part of its process loop.
Grafana
Grafana is not part of the Prometheus suite. It is an open source observability system designed to pull in data from multiple external data sources and integrate the data into customizable visualization dashboards. Grafana can pull data in from a variety of external system types, including Prometheus. It's another powerful, open source application that you can use to create sophisticated dashboards with the data produced by your devices. Grafana can also be installed onto a general-purpose computer, such as a desktop or a Raspberry Pi Zero, 3, or 4. (I installed it on the Raspberry Pi 4 that hosts the Prometheus and Alertmanager services.)
There are plenty of tutorials available to help you get up and running with Grafana, including several on Opensource.com, such as The perfect combo with Prometheus and Grafana, and more industry trends and Monitoring Linux performance with Grafana.
Once Grafana is installed, use your browser to navigate to the Grafana host's hostname or internet protocol address (IP) at port 3000, and log in with the default credentials (blank / admin). Make sure to change the admin password. You can then add a data source and use the menu to choose the Prometheus main server's IP or host and port. Once you add the data source, you can start to graph data from Prometheus or create dashboards.
If you are installing any of the above on a Raspberry Pi, ensure you download the Prometheus and Grafana binary distributions for your CPU's architecture. On a running Raspberry Pi, you can use either of these commands:
uname -mcat /proc/cpuinfo
to get cpu architecture. It will say something like armv7.
Connect the Raspberry Pi Zero's sensors
Once you have somewhere to store the data, you can assemble and configure the greenhouse monitoring device. I flashed the MicroSD card with the Raspberry Pi OS Lite image and configured it for headless connection over WiFi. I plugged the Qwiiic pHAT onto the Pi Zero headers and connected the Qwiic cables from the Qwiic pHAT to each of the light and environmental combo sensors. (Be sure to plug the yellow cable into the Qwiic pHAT on the side with the Pi header connection and into the sensors on the side with the I2C solder connection holes.) It is also possible to daisy-chain the sensors if you have only one Qwiic connection to your Raspberry Pi.

(Darin London, CC BY-SA 4.0)
Once the Raspberry Pi is connected to the sensors, plug the SD card into its slot, connect the power supply, and power it up. It will boot up, and then you should be able to connect to the Raspberry Pi using:
ssh pi@raspbberrypi.localThe default password is raspberry, but change it to something more secure using the passwd command. You can also use ping on your desktop to get the host's IP address and use it instead of the raspberrypi.local address. (This is useful if you have multiple Pis on your network.)
Install Node Exporter
Install the Node Exporter application on your Raspberry Pi Zero by downloading the binary distribution for your architecture from the Prometheus website. Once it is installed, configure it as a systemd service so that it automatically starts and stops with the Raspberry Pi.
Install Python sensor libraries
Raspberry Pi OS comes with Python 3, but it does not include the libraries required to interact with the sensors. Fortunately, there are Python libraries available.
Install SparkFun's official Qwiic_Py library to access the sensors on the Environmental Combo breakout. If you are using Raspberry Pi OS Lite, you have to install pip (the Python package installer) for Python 3:
sudo apt install python3-pipThe light sensor does not yet have an official SparkFun or Adafruit Python package, but you can get an open source vml6030.py package from its GitHub repo and copy it to /home/pi to use it in your monitoring application. It is based on the official SparkFun Arduino library.
Install the greenhouse monitor code
The greenhouse_monitor.py script in this project's GitHub repo uses the Python sensor libraries to append metrics for ambient_temperature, ambient_humidity, and ambient_light every 11 seconds to a file named /home/pi/metrics.prom in the format Prometheus expects:
#!/usr/bin/python3

from veml6030 import VEML6030
import smbus2
import qwiic_bme280
import time
import sys

def instrument_metrics(light,temp,humidity):
  metrics_out = open('/home/pi/metrics.prom', 'w+')
  print('# HELP ambient_temperature temperature in fahrenheit', flush=True, file=metrics_out)
  print('# TYPE ambient_temperature gauge', flush=True, file=metrics_out)
  print(f'ambient_temperature {temp}', flush=True, file=metrics_out)
  print('# HELP ambient_light light in lux', flush=True, file=metrics_out)
  print('# TYPE ambient_light gauge', flush=True, file=metrics_out)
  print(f'ambient_light {light}', flush=True, file=metrics_out)
  print('# HELP ambient_humidity humidity in %RH', flush=True, file=metrics_out)
  print('# TYPE ambient_humidity gauge', flush=True, file=metrics_out)
  print(f'ambient_humidity {humidity}', flush=True, file=metrics_out)
  metrics_out.close()

print("Starting Greenhouse Monitor")
bus = smbus2.SMBus(1)  # For Raspberry Pi
light_sensor = VEML6030(bus)
environment_sensor = qwiic_bme280.QwiicBme280()

if environment_sensor.is_connected() == False:
	print("The Environment Sensor isn't connected to the system. Please check your connection", file=sys.stderr)
	exit(1)
environment_sensor.begin()
while True:
	light = light_sensor.read_light()
	temp = environment_sensor.temperature_fahrenheit
	humidity = environment_sensor.humidity
	instrument_metrics(light, temp, humidity)
	time.sleep(11)
This can be set up as a systemd service, /etc/systemd/system/greenhouse_montor.service:
[Unit]
Description=Greenhouse Monitor
Documentation=https://github.com/prometheus/node_exporter
After=network-online.target

[Service]
User=pi
Restart=on-failure

ExecStart=/home/pi/greenhouse_monitor.py

[Install]
WantedBy=multi-user.target
A Node Exporter can also be configured as a systemd service to publish the metrics file produced by the greenhouse_montitor.py script at /etc/systemd/system/node_exporter.service:
[Unit]
Description=Node Exporter
Documentation=https://github.com/prometheus/node_exporter
After=network-online.target

[Service]
User=pi
Restart=on-failure

ExecStart=/usr/local/bin/node_exporter \
  --no-collector.arp \
  --no-collector.bcache \
  --no-collector.bonding \
  --no-collector.btrfs \
  --no-collector.cpu --no-collector.cpufreq --no-collector.edac --no-collector.entropy --no-collector.filefd --no-collector.hwmon --no-collector.ipvs \
  --no-collector.loadavg \
  --no-collector.mdadm \
  --no-collector.meminfo \
  --no-collector.netdev \
  --no-collector.netstat \
  --no-collector.nfs \
  --no-collector.nfsd \
  --no-collector.rapl \
  --no-collector.softnet \
  --no-collector.stat \
  --no-collector.time \
  --no-collector.timex \
  --no-collector.uname \
  --no-collector.vmstat \
  --no-collector.xfs \
  --no-collector.zfs \
  --no-collector.netclass \
  --no-collector.powersupplyclass \
  --no-collector.pressure \
  --no-collector.diskstats \
  --no-collector.filesystem \
  --no-collector.conntrack \
  --no-collector.infiniband \
  --no-collector.schedstat \
  --no-collector.sockstat \
  --no-collector.thermal_zone \
  --no-collector.udp_queues \
  --collector.textfile.directory=/home/pi

[Install]
WantedBy=multi-user.target
Note that you can leave off all the --nocollector.* arguments, and node_exporter will export lots of metrics about the Raspberry Pi host and the greenhouse_monitor data.
Once the systemd service definitions are in place, you can add and enable them using systemctl, and they will start as soon as your Raspberry Pi boots up and has a network:
sudo systemctl enable greenhouse_monitor.py
sudo systemctl enable node_exporter
You can troubleshoot these services using:
sudo systemctl status $servicenameThe Python script and systemd service definition files are available in the project's GitHub repo.
Restart the Raspberry Pi Zero and start monitoring
When the Raspberry Pi starts, it will start greenhouse_monitor.py and the node_exporter service. You can visit the node_exporter service using the IP or hostname of the Raspberry Pi running the greenhouse monitor at port 9100 (e.g., https://$ip:9100). Refresh every 11 seconds to see new entries.
Configure the Prometheus server scrape endpoint
Once your greenhouse monitor's Node Exporter is exporting metrics, you can configure the Prometheus service to scrape it. Add the following lines to the prometheus.yml configuration file within the scrape_configs section (replace the IP in the targets with the IP of the device running the greenhouse_monitoring service on your network):
  - job_name: 'greenhouse_monitor'

	# metrics_path defaults to '/metrics'
	# scheme defaults to 'http'.

	static_configs:
	- targets: ['192.168.1.12:9100']
Prometheus will automatically load the configuration file every few seconds and start scraping your greenhouse monitor. You can verify that it has started scraping (and get its up/down status) by visiting the Prometheus web user interface (UI) targets page at https://$prometheus_host:9090/targets.
If it is up (and green), you can query metrics in the Prometheus web UI graphs page https://$prometheus_host:9090/graph.

(Darin London, CC BY-SA 4.0)
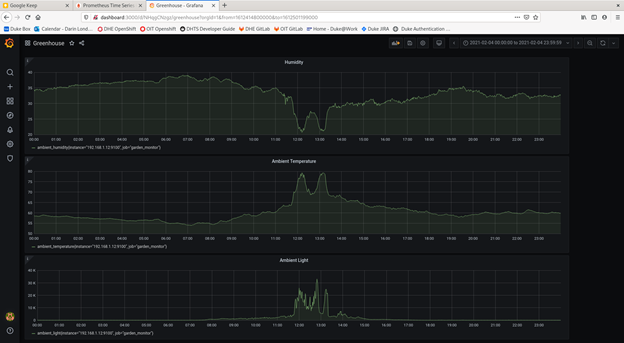
Once you are getting data in Prometheus, you can visit the Grafana service at https://$graphana_host:3000. I created a dashboard called Greenhouse with the panels for the three metrics exported by the greenhouse monitor. You can set Grafana to show data in the panels using the time controls. I was able to get the values for a 24-hour period from midnight to 11:59:59pm on the same day using the format from: YYYY-MM-DD 00:00:00 and To: YYYY-MM-DD 23:59:59.

(Darin London, CC BY-SA 4.0)
Notice the time of day when the sun was shining through a window onto the device?
What should you measure next?
You have a treasure-trove of data at your fingertips to examine the physical world. Next, you could configure Alertmanager to send notifications through various communication technologies (e.g., webhooks, Slack, Gmail, PagerDuty, etc.) when alerts configured in Prometheus are firing.
Now that you know how to measure your world, the question becomes: What do you want to measure?


2 Comments