You may have heard of Grafana, a time-series dashboarding tool that helps you discover what's going on in your environment. People from hobbyists to enterprise professionals like to use it for visualizations because it is open source and can accept data from myriad sources. This article describes how to use it to monitor your Raspberry Pi as an example of Internet of Things (IoT) monitoring.
It uses Grafana's latest offering, Grafana Cloud, a hosted free version that requires a lot less work than setting it up yourself. You can do everything in this article by downloading and installing Grafana, but the hosted version is convenient and lets you focus on other work. (If you really want to experience the pain of setting it up and hosting, you can, but let's be honest… you probably just want this handy free account.)
Set up your Raspberry Pi
Getting a Raspberry Pi working is fairly straightforward. You start by purchasing any of the available Raspberry Pi hardware, and then you install the operating system of your choice. Most people use the officially supported Raspberry Pi OS, so I will assume you are, too, but really any Linux distro will suffice.
Before moving ahead, you need to know your Raspberry Pi's hardware architecture. If you know your Pi's model number, you can look up your architecture on this Wikipedia specs list. Look at the row labeled "Instruction set." The name you see is your hardware architecture.
Install Prometheus
Next, install Prometheus, which is an open source time-series database. Interesting side note: Kubernetes was the first project to be made official by the Cloud Native Computing Foundation (CNCF); the second was Prometheus. Not everyone realizes that Prometheus is useful for smaller projects.
To install Prometheus:
- Find the latest version of Prometheus for your architecture on the Download page. Right-click on the file name, and copy the link.
- Open a terminal window. In the terminal, use wget to download the file you need. Use the command:
wget https://github.com/prometheus/prometheus/releases/download/vx.xx.x/prometheus-x.xx.x.linux-armvx.tar.gzbut replace x.xx.x with the latest version of Prometheus and the single x (in
armvx) with the ARM version you need. For example, if you are using armv6 and downloading Prometheus v2.24.0, enter:wget https://github.com/prometheus/prometheus/releases/download/v2.24.0/prometheus-2.24.0.linux-armv6.tar.gzWith Raspberry Pi, you need to replace
arm6in any commands witharmv7,arm64, oramd64, depending on which Raspberry Pi you are using and whether you are using a 32-bit or 64-bit operating system. Generally, 64-bit Raspberry Pis can useamd64. - Expand the compressed file:
tar sfz prometheus-x.xx.x.linux-armv6.tar.gz - Enter the new Prometheus directory:
cd prometheus-x.xx.x.linux-armv6 - Run Prometheus:
./prometheus - Check that it is working by opening
https://localhost:9090/metricsin a browser. You can do this in the terminal using curl or replacelocalhostwith the Internet protocol address (IP) of the device and check it from an external browser. If you see metrics, you are all set! You will need to access this URL using the IP address later, so it is wise to check this now.
Sign up for Grafana Cloud
Grafana Cloud is the easiest way to start observing metrics, logs, and traces and visualize system metrics using dashboards. The free tier is enough to be useful, so that is what I recommend. All it takes is an email address, no credit card or anything else required.
To sign up for a Grafana Cloud account:
- Navigate to https://grafana.com/products/cloud/
- Click Start for free on the banner.
- Follow the instructions to finish setting up your account and access the Cloud Portal.
Connect Prometheus to Grafana Cloud
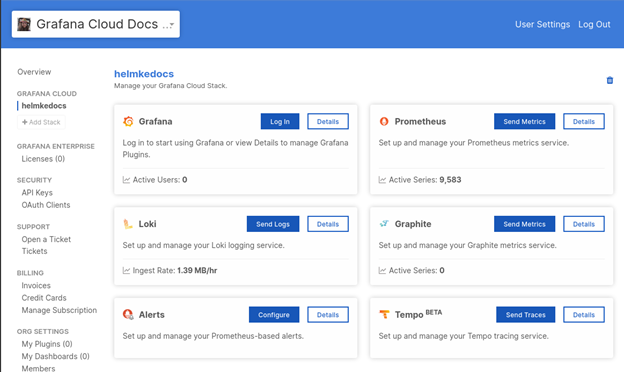
When you sign up for Grafana Cloud and log in, you will be taken to the portal.
(Matthew Helmke, CC BY-SA 4.0)
Go to the Prometheus card and click Details. Under the Sending Data to Prometheus heading, the page that opens provides details you need to add to your Prometheus configuration YAML file.
Stop Prometheus on your Raspberry Pi, and create a file in the same directory as the Prometheus binary called prometheus.yml. Add a blank line at the end of the file and paste in the configuration supplied above. Keep the file open, and go back to the portal.
On the Prometheus Details page in the portal, look for the line Password: Your Grafana.com API Key. Click Generate now to create an API key. Copy and paste the API key somewhere safe, as this is the only time you will see it. Enter the API key in prometheus.yml in the space labeled Password and save the file.
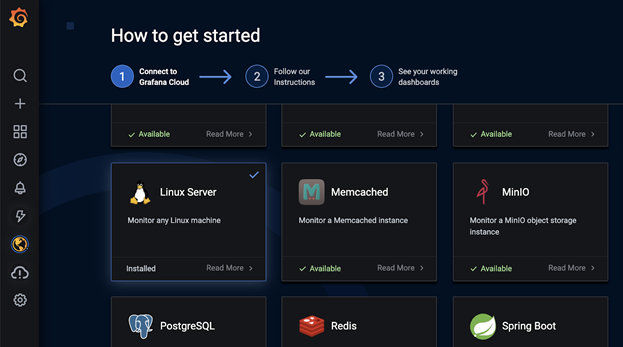
Go back to the main portal page. Click Log In on the Grafana card. This will open your Grafana Cloud instance. It will start the Integrations Walkthrough, but you can click the x at the top-right to exit.
(Matthew Helmke, CC BY-SA 4.0)
Hover over the Settings icon in the left-hand menu (it looks like a sprocket or gear). From the menu that appears, select Data Sources.
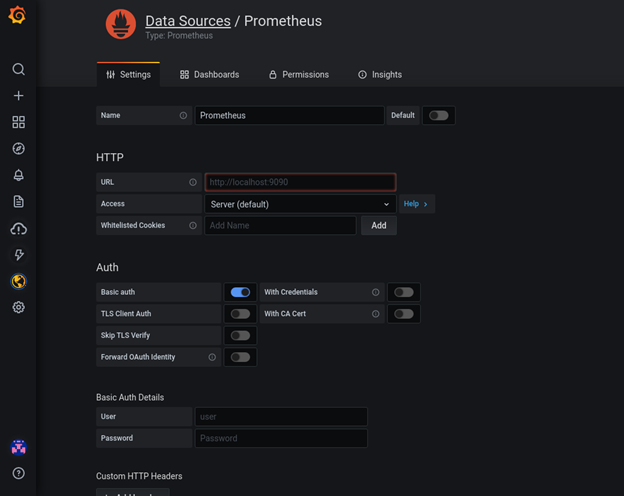
Create a new Prometheus data source by clicking Add data source.
(Matthew Helmke, CC BY-SA 4.0)
In the Settings tab:
- Enter the URL for your Raspberry Pi, including the port and metrics, as in Step 6 of Install Prometheus above.
- Select Basic Auth and, under Basic Auth Details, enter the user (it's the same number you found in the code generated for prometheus.yml), and enter the API key you generated as the password. Click Save & Test.
Select the Dashboards tab.
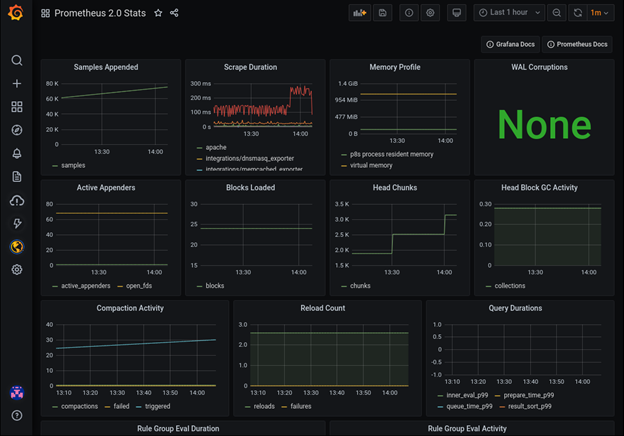
Click Import next to Prometheus 2.0 Stats to import that dashboard.
In Grafana's left-hand column, hover over the Dashboards icon (it looks like four squares), and select Manage from the menu that appears.
Find your new Prometheus 2.0 dashboard in the list and click to open it.
(Matthew Helmke, CC BY-SA 4.0)
Conclusion
Grafana Cloud and Prometheus are good choices for monitoring your Raspberry Pi. Give it a try, and share your experience in the comments.
Thanks to How to connect and monitor your Raspberry Pi with Grafana Cloud for some of the information in this article.





1 Comment