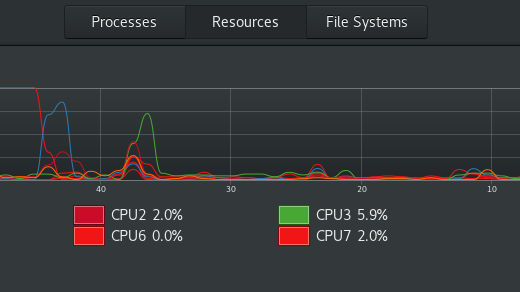
A process, in POSIX terminology, is an ongoing event being managed by an operating system’s kernel. A process is spawned when you launch an application, although there are many other processes running in the background of your computer, including programs to keep your system time accurate, to monitor for new filesystems, to index files, and so on.
Most operating systems have a system activity monitor of some kind so you can learn what processes are running at any give moment. Linux has a few for you to choose from, including GNOME System Monitor and KSysGuard. Both are useful applications on the desktop, but Linux also provides the ability to monitor your system in your terminal. Regardless of which you choose, it’s a common task for those who take an active role in managing their computer is to examine a specific process.
In this article, I demonstrate how to find the process ID (PID) of a program. The most common tools for this are provided by the procps-ng package, including the ps and pstree, pidof, and pgrep commands.
Find the PID of a running program
Sometimes you want to get the process ID (PID) of a specific application you know you have running. The pidof and pgrep commands find processes by command name.
The pidof command returns the PIDs of a command, searching for the exact command by name:
$ pidof bash
1776 5736
The pgrep command allows for regular expressions (regex):
$ pgrep .sh
1605
1679
1688
1776
2333
5736
$ pgrep bash
5736
Find a PID by file
You can find the PID of the process using a specific file with the fuser command.
$ fuser --user ~/example.txt
/home/tux/example.txt:  3234(tux)
Get a process name by PID
If you have the PID number of a process but not the command that spawned it, you can do a "reverse lookup" with ps:
$ ps 3234
 PID TTY      STAT   TIME COMMAND
5736 pts/1    Ss     0:00 emacs
List all processes
The ps command lists processes. You can list every process on your system with the -e option:
$ ps -e | less
PID TTY          TIME CMD
  1 ?        00:00:03 systemd
  2 ?        00:00:00 kthreadd
  3 ?        00:00:00 rcu_gp
  4 ?        00:00:00 rcu_par_gp
  6 ?        00:00:00 kworker/0:0H-events_highpri
[...]
5648 ?        00:00:00 gnome-control-c
5656 ?        00:00:00 gnome-terminal-
5736 pts/1    00:00:00 bash
5791 pts/1    00:00:00 ps
5792 pts/1    00:00:00 less
(END)
List just your processes
The output of ps -e can be overwhelming, so use -U to see the processes of just one user:
$ ps -U tux | less
 PID TTY          TIME CMD
3545 ?        00:00:00 systemd
3548 ?        00:00:00 (sd-pam)
3566 ?        00:00:18 pulseaudio
3570 ?        00:00:00 gnome-keyring-d
3583 ?        00:00:00 dbus-daemon
3589 tty2     00:00:00 gdm-wayland-ses
3592 tty2     00:00:00 gnome-session-b
3613 ?        00:00:00 gvfsd
3618 ?        00:00:00 gvfsd-fuse
3665 tty2     00:01:03 gnome-shell
[...]
That produces 200 fewer (give or take a hundred, depending on the system you're running it on) processes to sort through.
You can view the same output in a different format with the pstree command:
$ pstree -U tux -u --show-pids
[...]
├─gvfsd-metadata(3921)─┬─{gvfsd-metadata}(3923)
│                      └─{gvfsd-metadata}(3924)
├─ibus-portal(3836)─┬─{ibus-portal}(3840)
│                   └─{ibus-portal}(3842)
├─obexd(5214)
├─pulseaudio(3566)─┬─{pulseaudio}(3640)
│                  ├─{pulseaudio}(3649)
│                  └─{pulseaudio}(5258)
├─tracker-store(4150)─┬─{tracker-store}(4153)
│                     ├─{tracker-store}(4154)
│                     ├─{tracker-store}(4157)
│                     └─{tracker-store}(4178)
└─xdg-permission-(3847)─┬─{xdg-permission-}(3848)
			└─{xdg-permission-}(3850)
List just your processes with context
You can see extra context for all of the processes you own with the -u option.
$ ps -U tux -u
USER  PID %CPU %MEM    VSZ   RSS TTY STAT START  TIME COMMAND
tux  3545  0.0  0.0  89656  9708 ?   Ss   13:59  0:00 /usr/lib/systemd/systemd --user
tux  3548  0.0  0.0 171416  5288 ?   S    13:59  0:00 (sd-pam)
tux  3566  0.9  0.1 1722212 17352 ?  S<sl 13:59  0:29 /usr/bin/pulseaudio [...]
tux  3570  0.0  0.0 664736  8036 ?   SLl  13:59  0:00 /usr/bin/gnome-keyring-daemon [...]
[...]
tux  5736  0.0  0.0 235628  6036 pts/1 Ss 14:18  0:00 bash
tux  6227  0.0  0.4 2816872 74512 tty2 Sl+14:30  0:00 /opt/firefox/firefox-bin [...]
tux  6660  0.0  0.0 268524  3996 pts/1 R+ 14:50  0:00 ps -U tux -u
tux  6661  0.0  0.0 219468  2460 pts/1 S+ 14:50  0:00 less
Troubleshoot with PIDs
If you’re having trouble with a specific application, or you’re just curious about what else on your system an application uses, you can see a memory map of the running process with pmap:
$ pmap 1776
5736:   bash
000055f9060ec000   1056K r-x-- bash
000055f9063f3000     16K r---- bash
000055f906400000     40K rw---   [ anon ]
00007faf0fa67000   9040K r--s- passwd
00007faf1033b000     40K r-x-- libnss_sss.so.2
00007faf10345000   2044K ----- libnss_sss.so.2
00007faf10545000      4K rw--- libnss_sss.so.2
00007faf10546000 212692K r---- locale-archive
00007faf1d4fb000   1776K r-x-- libc-2.28.so
00007faf1d6b7000   2044K ----- libc-2.28.so
00007faf1d8ba000      8K rw--- libc-2.28.so
[...]
Process IDs
The procps-ng package has all the commands you need to investigate and monitor what your system is using at any moment. Whether you’re just curious about how all the disparate parts of a Linux system fit together, or whether you’re investigating an error, or you’re looking to optimize how your computer is performing, learning these commands gives you a significant advantage for understanding your OS.


1 Comment