Monitoring IT assets is an essential task for any IT department. Still, due to the growing number of devices in corporate networks, it is getting more and more challenging to find an approach that is flexible enough to monitor the wide range of available systems properly. It's essential to have a monitoring tool that is flexible, scalable, and easy to use.
In this article, I demonstrate how to install Checkmk, the monitoring tool from tribe29, and how to monitor servers and network devices with it.
Install Checkmk on Linux
For this article, I use the Checkmk Raw Edition, the community GPLv2 edition (the enterprise edition has extra features and paid support), and installing it on a Linux server. Checkmk runs on Linux, including RHEL, CentOS, Debian, and others, as well as in a container, or as a virtual appliance. You can download the latest Checkmk version for all platforms from the official Checkmk website.
Getting started
It doesn't take long to get started because Checkmk already supports most monitoring use cases thanks to its almost 2,000 plug-ins. Checkmk also provides preconfigured thresholds for alerts and warnings, so you don't have to waste time configuring these yourself, and of course, you can customize these as required.
Besides these official integrations, you can also use monitoring expansions created and shared by other users on the Checkmk Exchange. If you want to know more about the Checkmk tool or contribute to it, you can check out the GitHub repository.
This tutorial does not require any monitoring experience. If you do want to follow this procedure, though, you must have root access to the server you're using as the host.
Select and download the Checkmk Raw Edition
- Download either the Checkmk Raw Edition (it's free and open source) or the Checkmk Free Edition of the Enterprise Edition.
- Next, send the installer file to the server you want to host Checkmk on. I use the scp command. In this tutorial, the IP address for my host is 10.0.2.15.
$ scp check-mk-raw-X.Y.Zp8_0.focal_amd64.deb tux@10.0.2.15:/tmpAll further actions in this tutorial are performed on the host server.
- Log in to your host using
ssh.
$ ssh tux@10.0.2.15
Install the Checkmk package
- Now you must install the package including all of its dependencies. This can be done with your distribution's package manager, such as
aptordnf:
$ sudo apt install /tmp/check-mk-raw-X.Y.Zp8_0.focal_amd64.deb - Once the installation is complete, you can perform a test using the
omdcommand.
$ omd version
The omd command for Open Monitoring Distribution is an open source project created by Mathias Kettner, the founder of Checkmk. It helps you install a monitoring solution assembled from various open source components.
Create a Checkmk monitoring site
- The next step is to start an initial monitoring site (a "site" is an instance). Use
omd createto create a new Checkmk site and name it as you wish. In this example, I usecheckmk_demo.
$ sudo omd create checkmk_demo - As a response, you're provided with helpful information about how to start and access your Checkmk site. You could follow the steps to change your admin password right now, but I prefer to do that in the Checkmk user interface. So, for now, copy the randomly generated password (you need it in the next step) and start your monitoring site.
$ sudo omd start checkmk_demo
Should you want to drill deeper into Checkmk later on, it is important to understand what has just taken place.
- You created a new user, known as the site user, and a group with the site's name on your server.
- A directory for the site has been created under
/omd/sites, (for example,/omd/sites/checkmk_demo).
Checkmk also copied its default configuration into the new directory. - A user with the name cmkadmin was created for the Checkmk web interface.
Start monitoring with Checkmk
It's time to switch to the Checkmk user interface in your web browser. Every Checkmk site has its own URL, composed of the IP address or hostname of your monitoring server and the name of the Checkmk site. In this example, my Checkmk install is located at monitoring-host-server/checkmk_demo/.
- Open the link to your Checkmk site in your browser. You can open the link shown on your terminal.
- Log in as the cmkadmin user, using the password you copied from the terminal.
Once you're logged in, you see an empty dashboard. - Click on the User category in the sidebar on the left, and then click on Change password under Profile. Here, you can change your password.
Monitoring setup
Checkmk supports several ways of monitoring servers, and the best method for server monitoring is usually by using the Checkmk agents. Before adding a server, you need to install the agent.
- In the sidebar on the left, click Setup (the button with a gearwheel).
This is the control panel where you perform all of the configurations and find monitoring agents. There are some UI differences between the Raw Edition and the Enterprise Edition, but all screenshots in this article are from the open source Raw Edition. - Click on Agents and select the appropriate package for your operating system.
The packaged agents for Linux are provided in both RPM and DEB file formats.
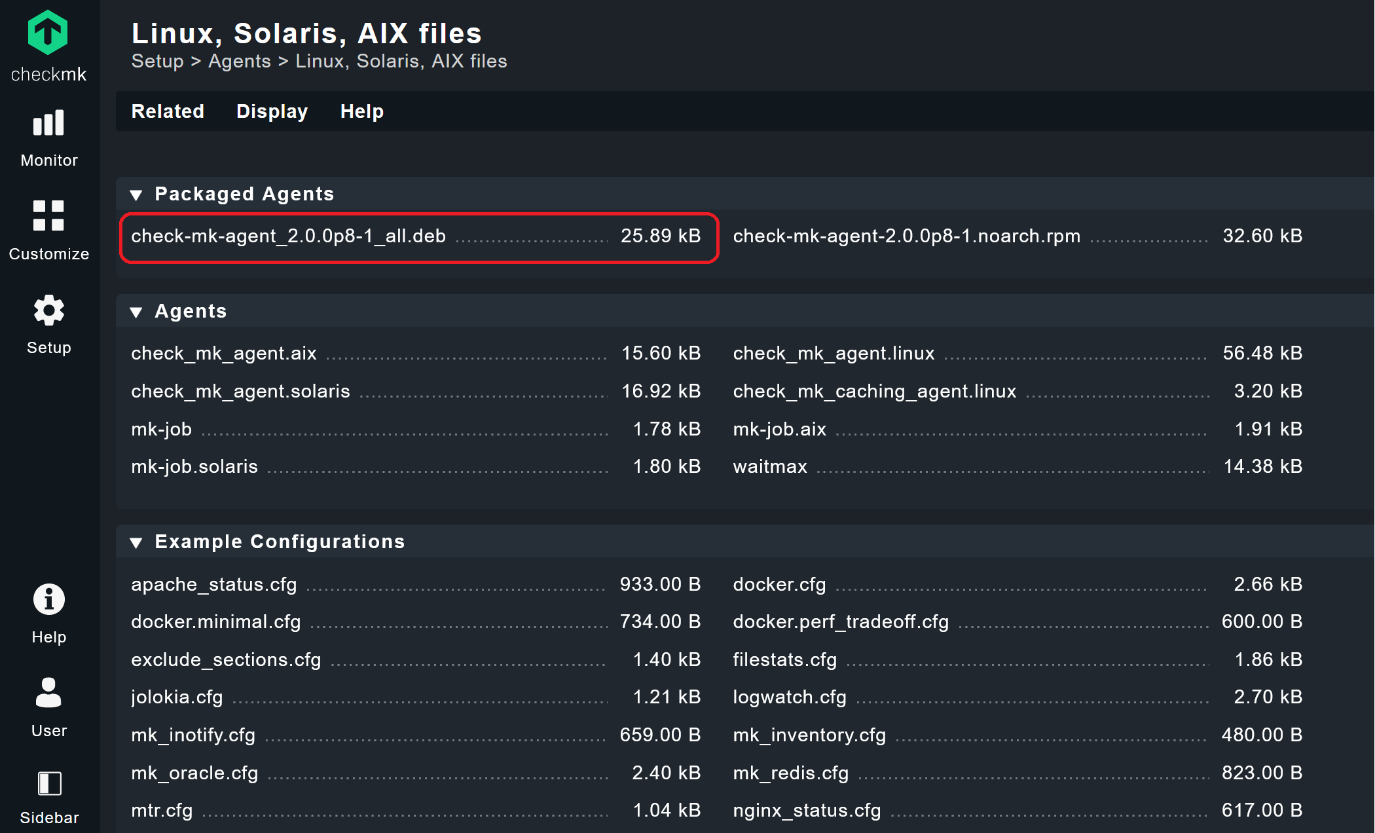
- Download and install the agent on your monitoring host.
You can test whether the agent works correctly by executing the check_mk_agent command in the terminal on your server.
Adding a host
Once the agent has been installed, return to the Setup screen and select Hosts.
- Click on Add host.
- Add the name of your server under Hostname.
If you have DNS set up in your network, Checkmk resolves the IP address for your hostname automatically. Otherwise, add the IP address by clicking the checkbox next to IPv4 Address. If you add an IP address, you can choose any hostname you like. Leave the other areas unchanged.
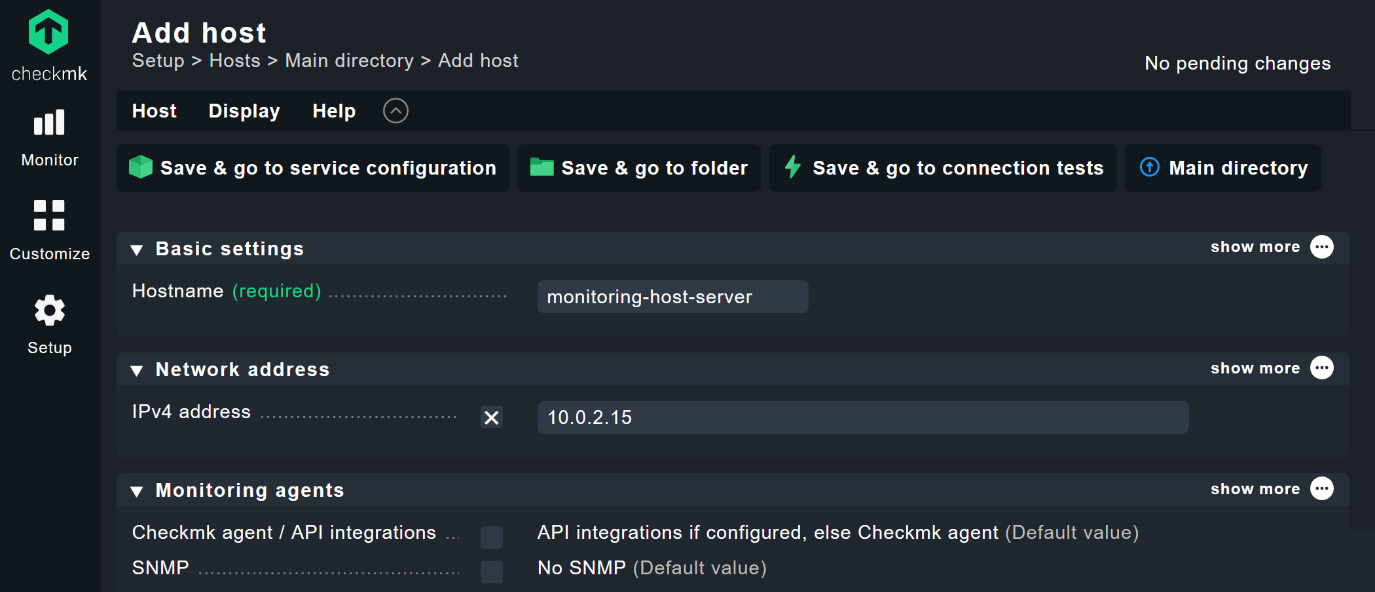
- Click on Save & go to service configuration. Checkmk now automatically discovers any relevant monitoring services on that host and lists them as Undecided services. Also, as you can see in the screenshot, Checkmk automatically adds labels depending on the type of device.
- Click on Fix all to monitor all of these. This adds all detected services and host labels to your monitoring dashboard and removes services that have vanished. Of course, you can manage the services manually, but the Fix all function makes it a lot easier.
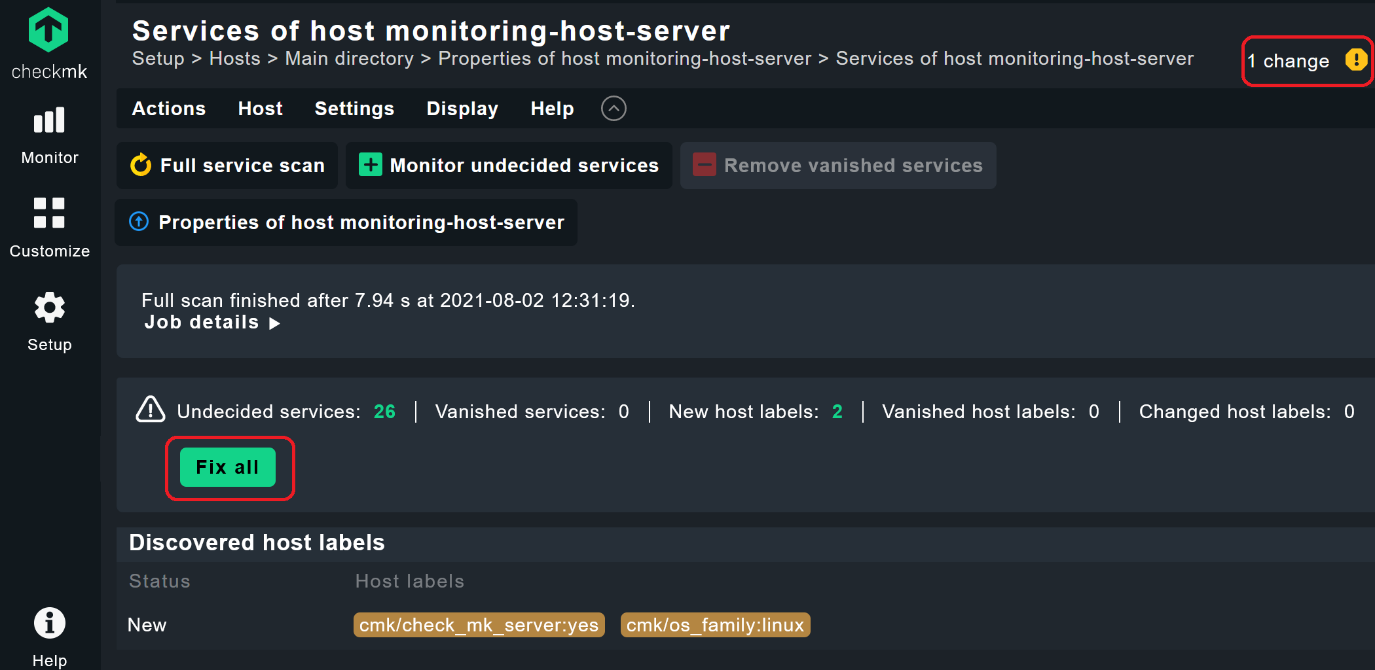
- Next, activate your changes by clicking on the highlighted field with the yellow exclamation point (!) at the top right corner. Click on Activate on selected sites, and you've successfully added the first server to your monitor.
Requiring explicit activation for changes is a safety mechanism. All changes made are listed first under Pending changes so you can review any changes before they affect your monitoring. Checkmk differentiates between Setup as a configuration environment, in which you manage the hosts, services, and settings, and the area called Monitor, in which the actual operational monitoring takes place. New hosts and other changes in the configuration initially do not affect the monitoring. You must activate these before they go into production.
SNMP monitoring
Besides server monitoring, another essential monitoring task is network monitoring. As an example, I would like to show you how to monitor a switch over SNMP. All you need to do is make sure the SNMP agent on the device you aim to monitor is activated and that your Checkmk server can reach this device.
- Go to Setup > Hosts and click on Add host.
- Type in the hostname and the IP address (as needed).
By default, Checkmk assumes you use a Checkmk agent, so you need to edit that under Monitoring agents. - Activate the check box next to SNMP and switch the box to your SNMP version (very likely ʻSNMP v2 or v3ʼ).
Checkmk also assumes by default that your SNMP Community is public because it is also the default on most SNMP devices. If that is the case, you can leave the box SNMP credentials unchecked (like I have). Otherwise, you have to check this box and add your SNMP credentials here.
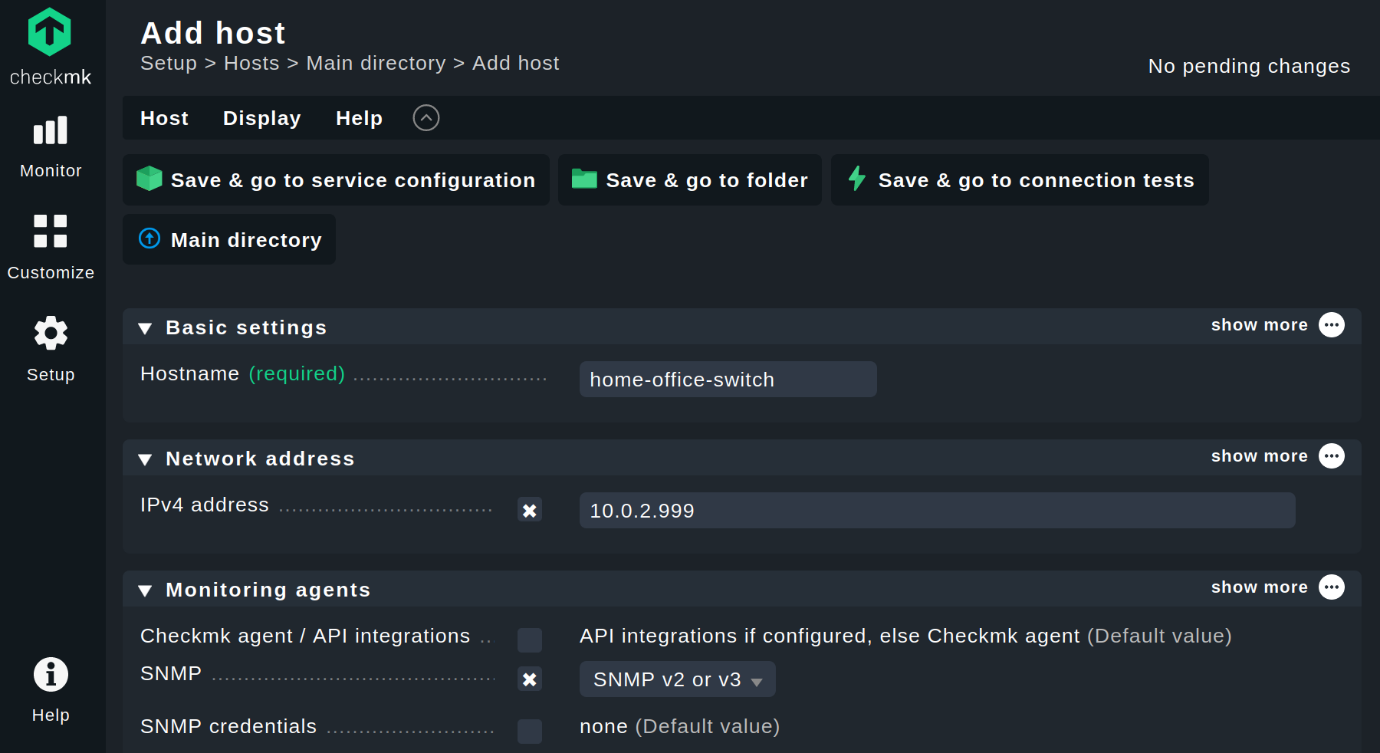
- As before, click on Save & go to service configuration, and Checkmk discovers all of the currently online interfaces, the uptime, and the SNMP Info check.
If a monitoring plug-in for a particular type of device exists, Checkmk detects more monitoring services automatically. - Click on Fix all and accept the changes.
Happy monitoring
Now you will have your Checkmk site up and running and have added two hosts. This tutorial ends here, but your real monitoring experience has only just started. You may have noticed that Checkmk provides agents for almost all operating systems so that you can add more hosts. The procedure is similar to other systems. Checkmk also supports SNMP, IPMI, HTML, and many other standards, so you always have an efficient method available for monitoring a particular system. Have a look at the Checkmk handbook, as well as in the official Checkmk forum. Happy monitoring!





1 Comment