In today's world and social media, many people don't have the patience to read lengthy textual content. Visuals are a great way to capture your audience's attention span.
Did you know that research at 3M Corporation concluded that visuals are processed 60,000 times faster than text? Visuals are more impactful than words and enhance creative thinking and memory.
A picture is worth a thousand words
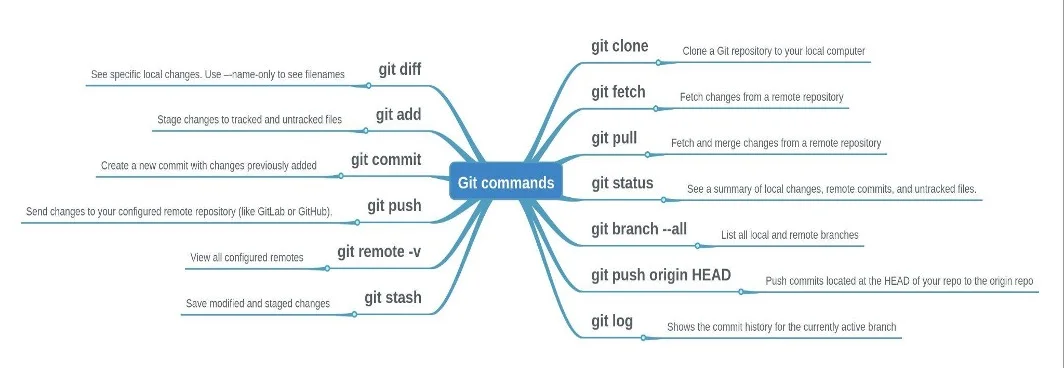
I looked at some of the common Git commands. I used Git commands as the main topic; each sub-topic is a Git command syntax with a definition. For this, I used Wisemapping.

(Amrita Sakthivel, CC BY-SA 4.0)
Whether you knew what a mind map was before or not, now that you've seen a mind map, you can now understand the concept.. That's the power of visuals.
How do you create a mind map?
- Start with the main topic and place it in the middle of your drawing board.
- Create sub-topics and link them to the main topic.
- You can add details to each sub-topic, such as definitions, examples, etc.
3 open source tools you can use to create a mind map
Take a look at these three open source tools to create a visual of your idea:
Wikipedia defines a mind map as a diagram to visually organize information into a hierarchy, showing relationships among pieces of the whole. Mind mapping starts with a central theme and then builds relations. It is a visual way to structure thoughts and create impactful presentations.
You can use mind maps in your work. For example, I used a mind map to show a high-level overview of features planned for a project. With these excellent open source mind mapping applications, it's easy to get started visualizing your next project. Try mapping your mind with open source.


1 Comment