Computers are integrated systems that only perform as fast as their slowest hardware component. If one component is less capable than the others—if it falls behind and can't keep up—it can hold your entire system back. That's a performance bottleneck. Removing a serious bottleneck can make your system fly.
This article explains how to identify hardware bottlenecks in Linux systems. The techniques apply to both personal computers and servers. My emphasis is on PCs—I won't cover server-specific bottlenecks in areas such as LAN management or database systems. Those often involve specialized tools.
I also won't talk much about solutions. That's too big a topic for this article. Instead, I'll write a follow-up article with performance tweaks.
I'll use only open source graphical user interface (GUI) tools to get the job done. Most articles on Linux bottlenecking are pretty complicated. They use specialized commands and delve deep into arcane details.
The GUI tools that open source offers make identifying many bottlenecks simple. My goal is to give you a quick, easy approach that you can use anywhere.
Where to start
A computer consists of six key hardware resources:
- Processors
- Memory
- Storage
- USB ports
- Internet connection
- Graphics processor
Should any one resource perform poorly, it can create a performance bottleneck. To identify a bottleneck, you must monitor these six resources.
Open source offers a plethora of tools to do the job. I'll use the GNOME System Monitor. Its output is easy to understand, and you can find it in most repositories.
Start it up and click on the Resources tab. You can identify many performance problems right off.
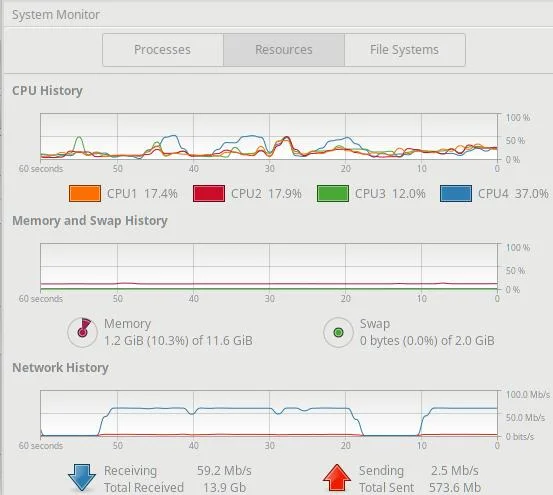
Fig. 1. System Monitor spots problems (Howard Fosdick, CC BY-SA 4.0)
The Resources panel displays three sections: CPU History, Memory and Swap History, and Network History. A quick glance tells you immediately whether your processors are swamped, or your computer is out of memory, or you're using up all your internet bandwidth.
I'll explore these problems below. For now, check the System Monitor first when your computer slows down. It instantly clues you in on the most common performance problems.
Now let's explore how to identify bottlenecks in specific areas.
How to identify processor bottlenecks
To spot a bottleneck, you must first know what hardware you have. Open source offers several tools for this purpose. I like HardInfo because its screens are easy to read and it's widely popular.
Start up HardInfo. Its Computer -> Summary panel identifies your CPU and tells you about its cores, threads, and speeds. It also identifies your motherboard and other computer components.
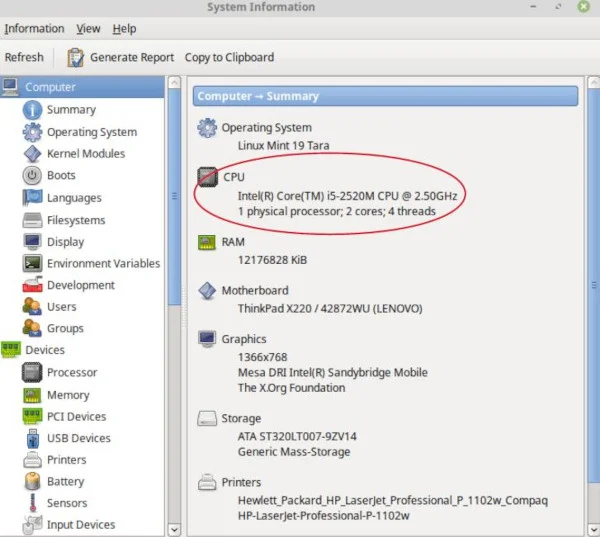
Fig. 2. HardInfo shows hardware details (Howard Fosdick, CC BY-SA 4.0)
HardInfo reveals that this computer has one physical CPU chip. That chip contains two processors, or cores. Each core supports two threads, or logical processors. That's a total of four logical processors—exactly what System Monitor's CPU History section showed in Fig. 1.
A processor bottleneck occurs when processors can't respond to requests for their time. They're already busy.
You can identify this when System Monitor shows logical processor utilization at over 80% or 90% for a sustained period. Here's an example where three of the four logical processors are swamped at 100% utilization. That's a bottleneck because it doesn't leave much CPU for any other work.

Fig. 3. A processor bottleneck (Howard Fosdick, CC BY-SA 4.0)
Which app is causing the problem?
You need to find out which program(s) is consuming all that CPU. Click on System Monitor's Processes tab. Then click on the % CPU header to sort the processes by how much CPU they're consuming. You'll see which apps are throttling your system.
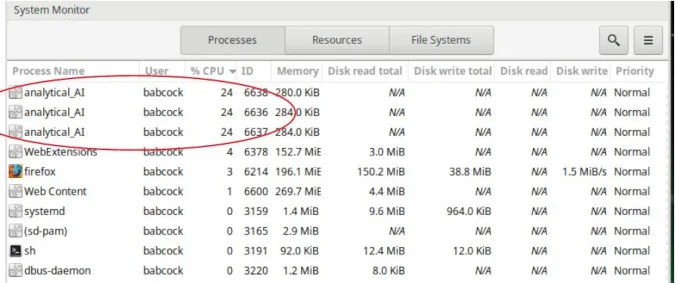
Fig. 4. Identifying the offending processes (Howard Fosdick, CC BY-SA 4.0)
The top three processes each consume 24% of the total CPU resource. Since there are four logical processors, this means each consumes an entire processor. That's just as Fig. 3 shows.
The Processes panel identifies a program named analytical_AI as the culprit. You can right-click on it in the panel to see more details on its resource consumption, including memory use, the files it has open, its input/output details, and more.
If your login has administrator privileges, you can manage the process. You can change its priority and stop, continue, end, or kill it. So, you could immediately resolve your bottleneck here.
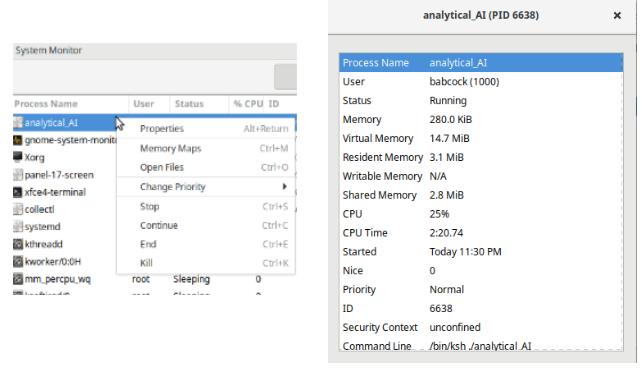
Fig. 5. Right-click on a process to manage It (Howard Fosdick, CC BY-SA 4.0)
How do you fix processing bottlenecks? Beyond managing the offending process in real time, you could prevent the bottleneck from happening. For example, you might substitute another app for the offender, work around it, change your behavior when using that app, schedule the app for off-hours, address an underlying memory issue, performance-tweak the app or your system software, or upgrade your hardware. That's too much to cover here, so I'll explore those options in my next article.
Common processor bottlenecks
You'll encounter several common bottlenecks when monitoring your CPUs with System Monitor.
Sometimes one logical processor is bottlenecked while all the others are at low utilization. This means you have an app that's not coded smartly enough to take advantage of more than one logical processor, and it's maxed out the one it's using. That app will take longer to finish than it would if it used more processors. On the other hand, at least it leaves your other processors free for other work and doesn't take over your computer.
You might also see a logical processor stuck forever at 100% utilization. Either it's very busy, or a process is hung. The way to tell if it's hung is if the process never does any disk activity (as the System Monitor Processes panel will show).
Finally, you might notice that when all your processors are bottlenecked, your memory is fully utilized, too. Out-of-memory conditions sometimes cause processor bottlenecks. In this case, you want to solve the underlying memory problem, not the symptomatic CPU issue.
How to identify memory bottlenecks
Given the large amount of memory in modern PCs, memory bottlenecks are much less common than they once were. Yet you can still run into them if you run memory-intensive programs, especially if you have a computer that doesn't contain much random access memory (RAM).
Linux uses memory both for programs and to cache disk data. The latter speeds up disk data access. Linux can reclaim that memory any time it needs it for program use.
The System Monitor's Resources panel displays your total memory and how much of it is used. In the Processes panel, you can see individual processes' memory use.
Here's the portion of the System Monitor Resources panel that tracks aggregate memory use:

Fig. 6. A memory bottleneck (Howard Fosdick, CC BY-SA 4.0)
To the right of Memory, you'll notice Swap. This is disk space Linux uses when it runs low on memory. It writes memory to disk to continue operations, effectively using swap as a slower extension to your RAM.
The two memory performance problems you'll want to look out for are:
- Memory appears largely used, and you see frequent or increasing activity on the swap space.
- Both memory and swap are largely used up.
Situation 1 means slower performance because swap is always slower than memory. Whether you consider it a performance problem depends on many factors (e.g., how active your swap space is, its speed, your expectations, etc.). My opinion is that anything more than token swap use is unacceptable for a modern personal computer.
Situation 2 is where both memory and swap are largely in use. This is a memory bottleneck. The computer becomes unresponsive. It could even fall into a state of thrashing, where it accomplishes little more than memory management.
Fig. 6 above shows an old computer with only 2GB of RAM. As memory use surpassed 80%, the system started writing to swap. Responsiveness declined. This screenshot shows over 90% memory use, and the computer is unusable.
The ultimate answer to memory problems is to either use less of it or buy more. I'll discuss solutions in my follow-up article.
How to identify storage bottlenecks
Storage today comes in several varieties of solid-state and mechanical hard disks. Device interfaces include PCIe, SATA, Thunderbolt, and USB. Regardless of which type of storage you have, you use the same procedure to identify disk bottlenecks.
Start with System Monitor. Its Processes panel displays the input/output rates for individual processes. So you can quickly identify which processes are doing the most disk I/O.
But the tool doesn't show the aggregate data transfer rate per disk. You need to see the total load on a specific disk to determine if that disk is a storage bottleneck.
To do so, use the atop command. It's available in most Linux repositories.
Just type atop at the command-line prompt. The output below shows that device sdb is busy 101%. Clearly, it's reached its performance limit and is restricting how fast your system can get work done.
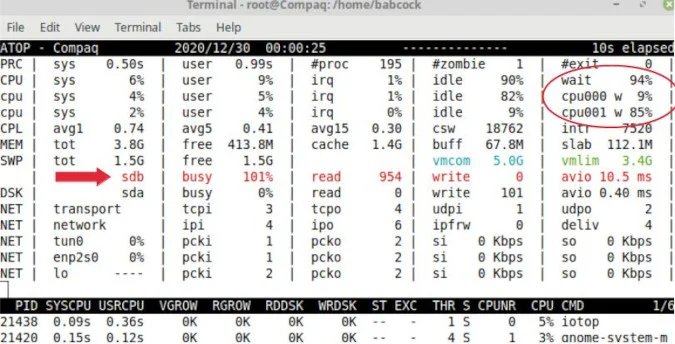
Fig. 7. The atop command identifies a disk bottleneck (Howard Fosdick, CC BY-SA 4.0)
Notice that one of the CPUs is waiting on the disk to do its job 85% of the time (cpu001 w 85%). This is typical when a storage device becomes a bottleneck. In fact, many look first at CPU I/O waits to spot storage bottlenecks.
So, to easily identify a storage bottleneck, use the atop command. Then use the Processes panel on System Monitor to identify the individual processes that are causing the bottleneck.
How to identify USB port bottlenecks
Some people use their USB ports all day long. Yet, they never check if those ports are being used optimally. Whether you plug in an external disk, a memory stick, or something else, you'll want to verify that you're getting maximum performance from your USB-connected devices.
This chart shows why. Potential USB data transfer rates vary enormously.
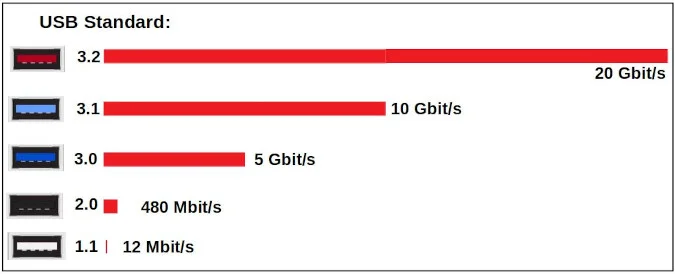
Fig. 8. USB speeds vary a lot (Howard Fosdick, based on figures provided by Tripplite and Wikipedia, CC BY-SA 4.0)
HardInfo's USB Devices tab displays the USB standards your computer supports. Most computers offer more than one speed. How can you tell the speed of a specific port? Vendors color-code them, as shown in the chart. Or you can look in your computer's documentation.
To see the actual speeds you're getting, test by using the open source GNOME Disks program. Just start up GNOME Disks, select its Benchmark Disk feature, and run a benchmark. That tells you the maximum real speed you'll get for a port with the specific device plugged into it.
You may get different transfer speeds for a port, depending on which device you plug into it. Data rates depend on the particular combination of port and device.
For example, a device that could fly at 3.1 speed will use a 2.0 port—at 2.0 speed—if that's what you plug it into. (And it won't tell you it's operating at the slower speed!) Conversely, if you plug a USB 2.0 device into a 3.1 port, it will work, but at the 2.0 speed. So to get fast USB, you must ensure both the port and the device support it. GNOME Disks gives you the means to verify this.
To identify a USB processing bottleneck, use the same procedure you did for solid-state and hard disks. Run the atop command to spot a USB storage bottleneck. Then, use System Monitor to get the details on the offending process(es).
How to identify internet bandwidth bottlenecks
The System Monitor Resources panel tells you in real time what internet connection speed you're experiencing (see Fig. 1).
There are great Python tools out there to test your maximum internet speed, but you can also test it on websites like Speedtest, Fast.com, and Speakeasy. For best results, close everything and run only the speed test; turn off your VPN; run tests at different times of day; and compare the results from several testing sites.
Then compare your results to the download and upload speeds that your vendor claims you're getting. That way, you can confirm you're getting the speeds you're paying for.
If you have a separate router, test with and without it. That can tell you if your router is a bottleneck. If you use WiFi, test with it and without it (by directly cabling your laptop to the modem). I've often seen people complain about their internet vendor when what they actually have is a WiFi bottleneck they could fix themselves.
If some program is consuming your entire internet connection, you want to know which one. Find it by using the nethogs command. It's available in most repositories.
The other day, my System Monitor suddenly showed my internet access spiking. I just typed nethogs in the command line, and it instantly identified the bandwidth consumer as a Clamav antivirus update.

Fig. 9. Nethogs identifies bandwidth consumers (Howard Fosdick, CC BY-SA 4.0)
How to identify graphics processing bottlenecks
If you plug your monitor into the motherboard in the back of your desktop computer, you're using onboard graphics. If you plug it into a card in the back, you have a dedicated graphics subsystem. Most call it a video card or graphics card. For desktop computers, add-in cards are typically more powerful and more expensive than motherboard graphics. Laptops always use onboard graphics.
HardInfo's PCI Devices panel tells you about your graphics processing unit (GPU). It also displays the amount of dedicated video memory you have (look for the memory marked "prefetchable").
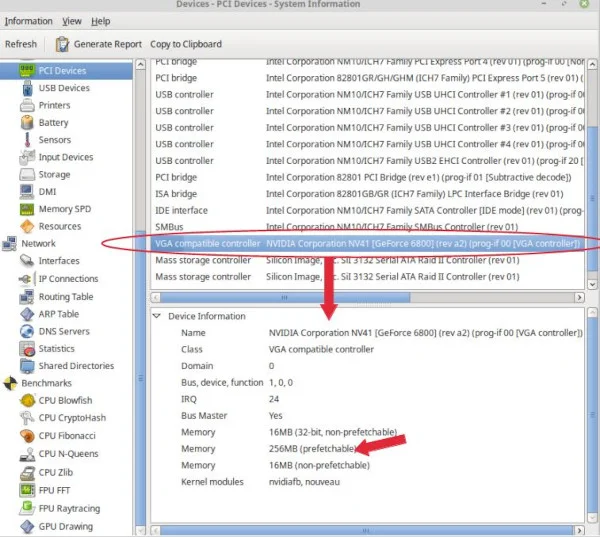
Fig. 10. HardInfo's graphics processing information (Howard Fosdick, CC BY-SA 4.0)
CPUs and GPUs work very closely together. To simplify, the CPU prepares frames for the GPU to render, then the GPU renders the frames.
A GPU bottleneck occurs when your CPUs are waiting on a GPU that is 100% busy.
To identify this, you need to monitor CPU and GPU utilization rates. Open source monitors like Conky and Glances do this if their extensions work with your graphics chipset.
Take a look at this example from Conky. You can see that this system has a lot of available CPU. The GPU is only 25% busy. Imagine if that GPU number were instead near 100%. Then you'd know that the CPUs were waiting on the GPU, and you'd have a GPU bottleneck.
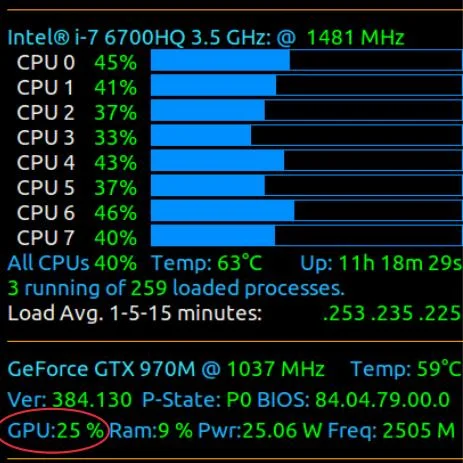
Fig. 11. Conky displaying CPU and GPU utilization (Image courtesy of AskUbuntu forum)
On some systems, you'll need a vendor-specific tool to monitor your GPU. They're all downloadable from GitHub and are described in this article on GPU monitoring and diagnostic command-line tools.
Summary
Computers consist of a collection of integrated hardware resources. Should any of them fall way behind the others in its workload, it creates a performance bottleneck. That can hold back your entire system. You need to be able to identify and correct bottlenecks to achieve optimal performance.
Not so long ago, identifying bottlenecks required deep expertise. Today's open source GUI performance monitors make it pretty simple.
In my next article, I'll discuss specific ways to improve your Linux PC's performance. Meanwhile, please share your own experiences in the comments.







Comments are closed.